PU Prime App
Exclusive deals on mobile


PU Prime App
Exclusive deals on mobile
Tenir les marchés mondiaux entre vos mains
Notre application de trading pour mobile est compatible avec la plupart des appareils intelligents. Téléchargez l’application dès maintenant et commencez à trader avec PU Prime sur tout appareil, à tout moment et en tout lieu.


5 September 2023,08:56
Daily Market Analysis
5 September 2023, 08:56


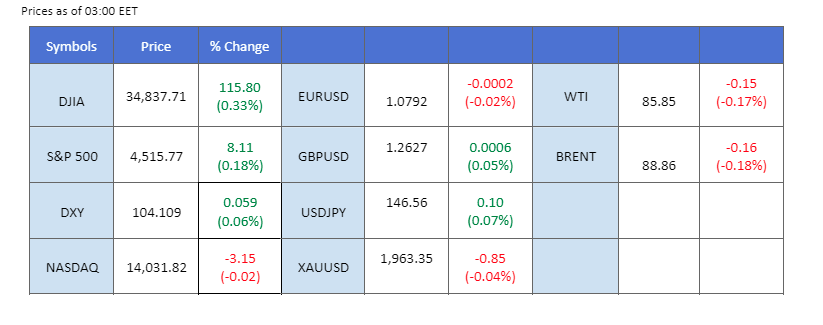
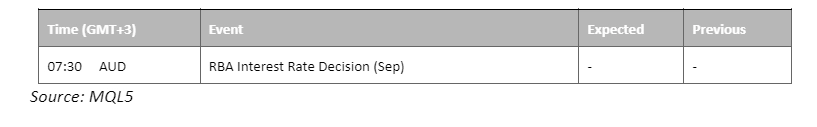
Last night, US markets observed Labor Day celebrations, resulting in a subdued environment across asset classes, marked by sideways trading. Conversely, China’s equity market experienced a morning session decline. The catalyst was a Caixin Services PMI reading that not only fell short of market consensus but also trailed the previous figure, underscoring persistent challenges in China’s ongoing economic recovery. Elsewhere, all eyes are on the Reserve Bank of Australia (RBA), set to announce its interest rate decision today. It’s widely anticipated that the central bank will maintain its current interest rate level, which could further pressure the already fragile Australian dollar. Meanwhile, oil prices have remained stable at their highest levels since last November, with market participants eagerly awaiting the next moves from OPEC+ regarding supply dynamics.
Current rate hike bets on 20th September Fed interest rate decision:
Source: CME Fedwatch Tool
0 bps (93.0%) VS 25 bps (7.0%)

Dollar-denominated assets experienced subdued trading on the back of the recent US holiday. The US dollar, navigating thin volumes, retreated slightly, influenced by a global risk-on sentiment. This shift followed China’s unveiling of a stimulus plan aimed at reinvigorating economic growth, while the outlook for the US economy remained shrouded in uncertainty due to mixed economic data.
The dollar index extended its gains following the prior breakout above the previous resistance level. However, MACD has illustrated diminishing bullish momentum, while RSI is at 62, suggesting the index might be traded lower as technical correction since the RSI retreated from the overbought territory.
Resistance level: 104.50, 105.15
Support level: 103.60, 102.80

In the realm of precious metals, the gold market continued to consolidate within a range defined by crucial support and resistance levels. The market grappled with mixed economic data from the US region, injecting further uncertainty.
Gold prices are trading lower following the prior retracement from the resistance level. MACD has illustrated increasing bearish momentum, while RSI is at 50, suggesting the commodity might extend its losses toward support level.
Resistance level: 1950.00, 1970.00
Support level: 1920.00, 1900.00

The euro exhibited limited price movement against the USD during the U.S. Labor Day celebrations. Despite a speech by ECB Chair Christine Lagarde in London touching on inflation concerns, the pair’s volatility remained subdued. Investors are now focusing on the upcoming release of Eurozone GDP data on Thursday, which could provide insights into the Euro’s future strength.
The EUR/USD is struggling and on the brink of falling below its crucial support level at 1.0780. The RSI has been hovering near the oversold zone while the MACD is flowing flat below the zero line, suggesting the momentum for the pair is minimal.
Resistance level: 1.0850, 1.0920
Support level: 1.0760, 1.0700
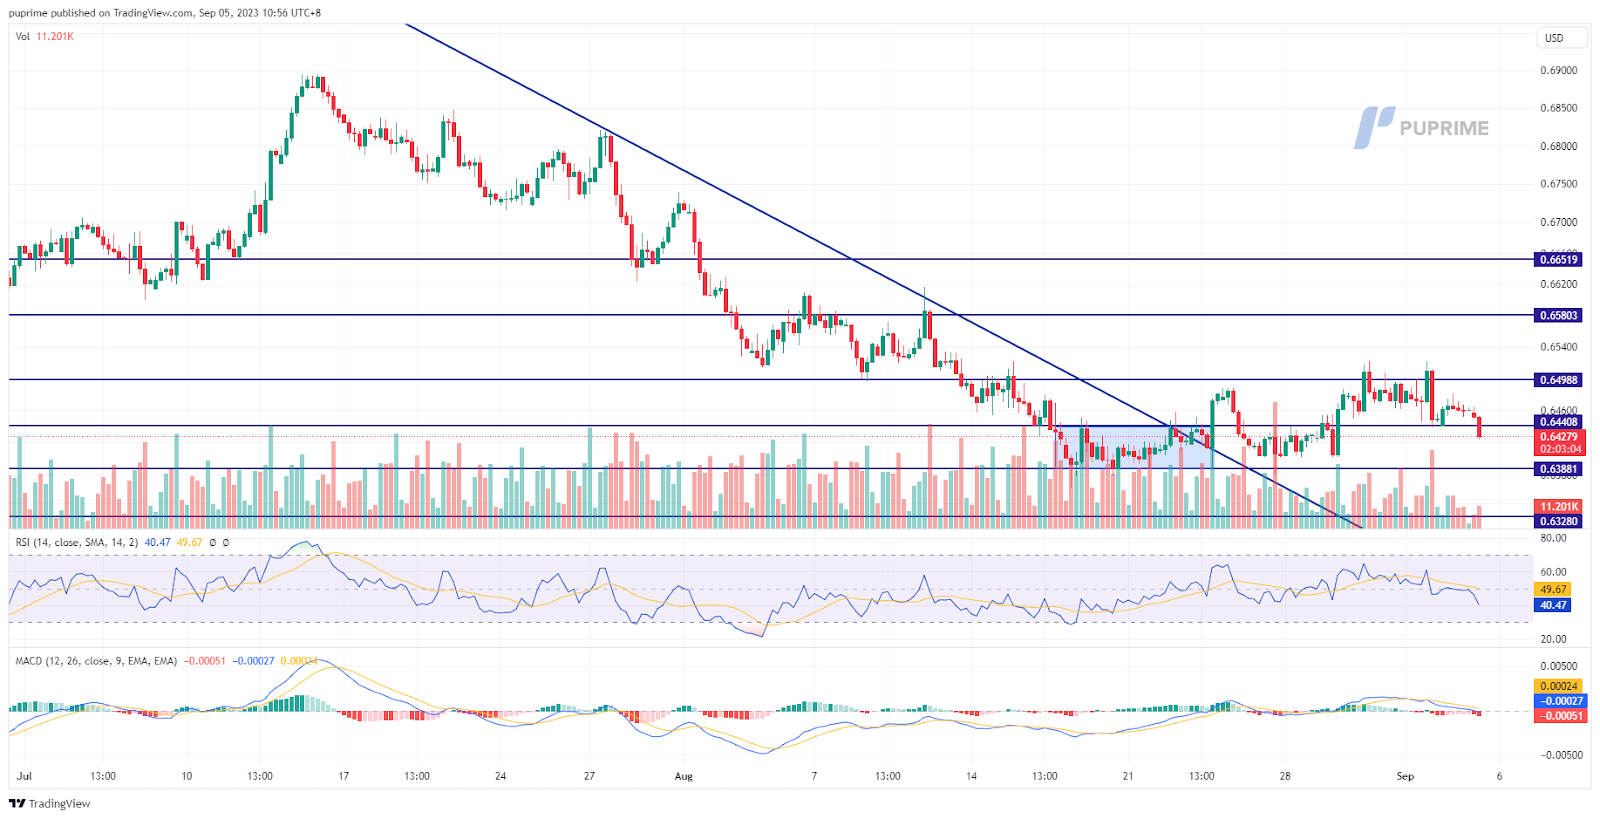
The Australian dollar broke out of its recent price consolidation range, driven by disappointing economic news out of China. China’s Caixin Services PMI came in at 51.8, lower than the previous reading of 54.1, indicating ongoing challenges in the country’s economic recovery. This data has added downward pressure on the already fragile Aussie dollar. Additionally, with the RBA expected to announce its interest rate decision today, and the market widely anticipating the central bank to maintain the current interest rate, it’s expected that the Aussie dollar will face further resistance in rebounding from its current levels.
The pair failed to hold above its close support level at 0.6440 suggesting a bearish signal for the pair. The indicators echo the suggestion as the RSI moving downward while the MACD is breaking below the zero line.
Resistance level: 0.6500, 0.6580
Support level: 0.6380, 0.6330

The Japanese yen extended its underperformance, driven by the Bank of Japan’s (BoJ) adoption of a more dovish stance. This shift in monetary policy reaffirmed the BoJ’s status as the sole central bank globally maintaining negative interest rates. Moreover, prospects of currency intervention by the BoJ remained bleak, exacerbating the downward pressure on the Japanese yen.
USD/JPY is trading higher following the prior breakout above the previous resistance level. MACD has illustrated increasing bullish momentum, while RSI is at 60, suggesting the pair might extend its gains toward resistance level.
Resistance level: 147.20, 148.25
Support level:146.25, 144.70
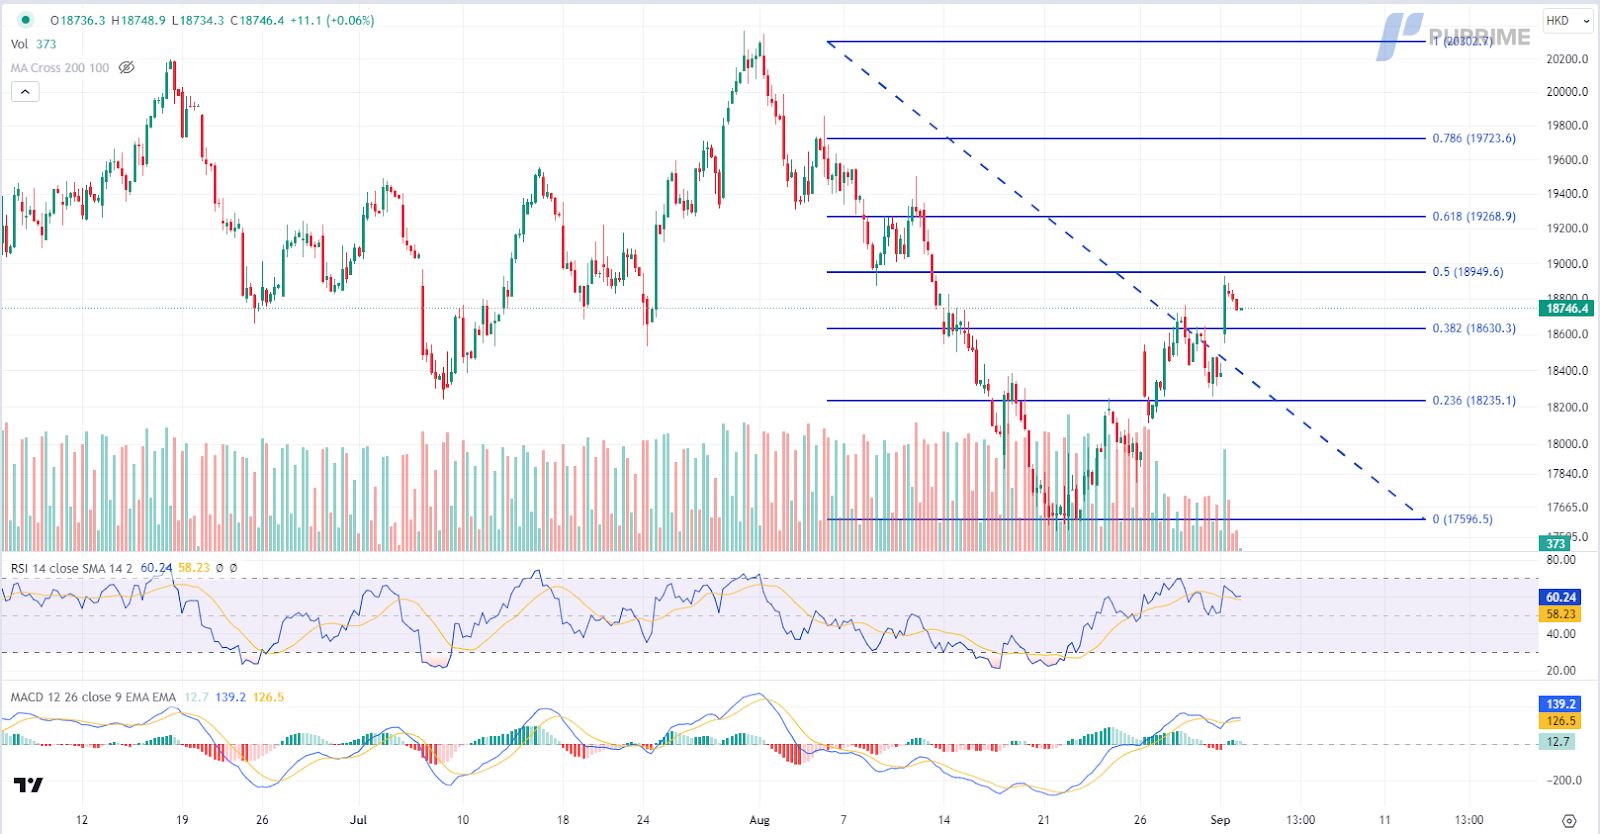
Chinese equities experienced an upswing, with the Hang Seng Index surging by over 2%. This rally was fueled by the Chinese government’s stimulus plan and news that Country Garden Holdings had garnered bondholder approval to extend certain debt deadlines. Notably, the stock of Country Garden Holdings soared by more than 15%, emerging as a top performer on the Hang Seng Index, as optimism mounted that the beleaguered property developer could avert a potential default.
HK50 is trading higher following the prior breakout above the resistance level. However, MACD has illustrated diminishing bullish momentum, while RSI is at 60, suggesting the index might be traded lower as technical correction since the RSI retreated sharply from overbought territory.
Resistance level: 18950.00, 19270.00
Support level: 18630.00, 18235.00

Oil prices remained buoyant, hovering near three-week highs, buoyed by optimism surrounding potential output cuts by leading crude producers. Russia’s mention of forthcoming supply reductions added to speculation that Saudi Arabia would extend its one million barrel per day production cut into October, further bolstering global supply constraints.
Oil prices are trading higher following the prior breakout above the previous resistance level. However, MACD has illustrated diminishing bullish momentum, while RSI is at 69, suggesting the commodity might enter overbought territory.
Resistance level: 87.25, 93.10
Support level: 83.80, 80.45

Tradez le Forex, les indices, Métaux et plus encore avec des spreads faibles et une exécution ultra-rapide.
Inscrivez-vous pour un compte réel PU Prime grâce à notre procédure simplifiée.
Approvisionnez facilement votre compte grâce à un large éventail de canaux et de devises acceptées.
Accédez à des centaines d’instruments avec les meilleures conditions de trading.
Plaquettes de trading
Entreprise
FAQs
Application PU Prime - Commencez à trader avec un avantage


Risk Warning: Trading Contract for Difference (CFD) carries a high level of risk to your capital and may result in losses that exceed your deposits due to leverage. It's important to understand how CFDs work and assess whether you can afford the high risk of losing your money. When acquiring our derivative products, you do not own or have rights in the underlying assets. Past performance is not indicative of future results. The information on this website is general and does not take into account your personal objectives, financial circumstances, or needs. Seek independent advice from qualified experts if necessary, and ensure you fully understand the risks before making any trading decisions.
PU Prime is a brand name of different entities authorised and registered in various jurisdictions.
PU Prime Limited is authorized and regulated by the Financial Services Authority of Seychelles under License No. SD050, with registered address at CT House, Office 1A, Providence, Mahe, Seychelles.
PU Prime Ltd is authorized and regulated by the Financial Services Commission of Mauritius under License No. GB23202672, with registered address at Suite 201 Level 2, The Catalyst Building, 40 Silicon Avenue, Cybercity Ebene, Mauritius.
PU Prime (Pty) Ltd is an authorised Financial Services Provider registered and regulated by the Financial Sector Conduct Authority of South Africa under License No. 52218, with registered address at 37 Harley Street, Ferndale, Randburg, Gauteng, South Africa.
The information on this website is not intended for residents of certain jurisdictions, including the United States, Singapore, Australia, China, Russia, and jurisdictions listed on the FATF and EU/UN sanctions lists. It is not intended for distribution or use where such distribution or use would be contrary to local law or regulation. While the Authority has granted a securities or derivatives investment business licence to the Licensee, it does not endorse the products offered.
Finzero Cap Ltd, registered in the Republic of Cyprus with registration number HE414308 and registered address at 62 Athalassas, Mezzanine, Strovolos 2012, Nicosia, Cyprus.
Copyright © 2024 PU Prime.
