


-
- Plateformes de trading
- Application PU Prime
- MetaTrader 5
- MetaTrader 4
- PU Copy Trading
- Trader Web
- PU Social
-
- Conditions de Trading
- Types de compte
- Spreads, Coûts et Swaps
- Dépôts et Retraits
- Frais et Charges
- Heures de Trading

20 February 2024,02:05
Daily Market Analysis
20 February 2024, 02:05


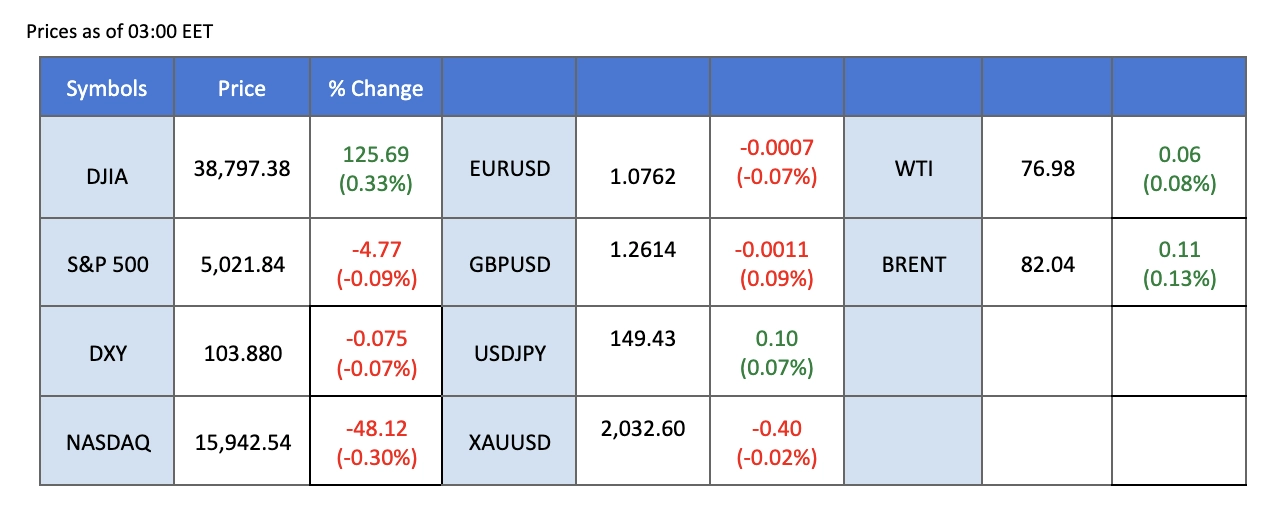
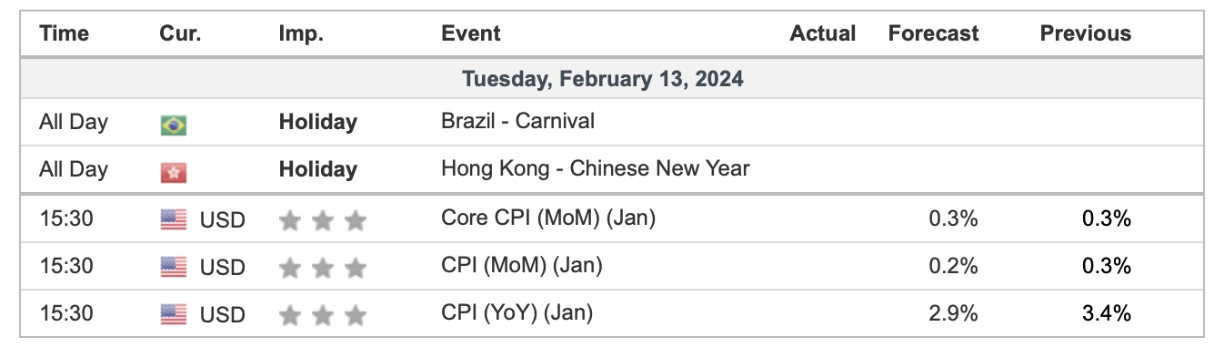
Dollar in consolidation mode ahead of key economic data, investors are advised to continue eyeing on US CPI.
The US Dollar adopts a consolidated stance in anticipation of key economic data, particularly US inflation and retail sales figures. Investors are closely monitoring the Consumer Price Index (CPI) for January, expecting a year-on-year increase of 2.90%, a slight dip from the preceding month. The US equity market experiences a modest retreat from all-time highs as investors engage in profit-taking ahead of pivotal economic data releases, with uncertainties lingering over the potential impact of US inflation data on Federal Reserve decisions. In the energy sector, oil prices continue their ascent due to global supply concerns and regional tensions, including threats to shipping in the Red Sea and geopolitical complexities surrounding the Israel-Hamas ceasefire negotiations.
Current rate hike bets on 20th March Fed interest rate decision:
Source: CME Fedwatch Tool
0 bps (82%) VS -25 bps (18%)
(MT4 System Time)
Source: MQL5
The US Dollar maintains a consolidated stance as investors await crucial data on US inflation and retail sales, seeking clues on potential shifts in the Federal Reserve’s monetary policy. Anticipation surrounds the Consumer Price Index (CPI) for January, with economists expecting a rise of 2.90% year-on-year, down from the previous month’s 3.4%. Investors are advised to closely monitor fresh economic data for nuanced trading signals.
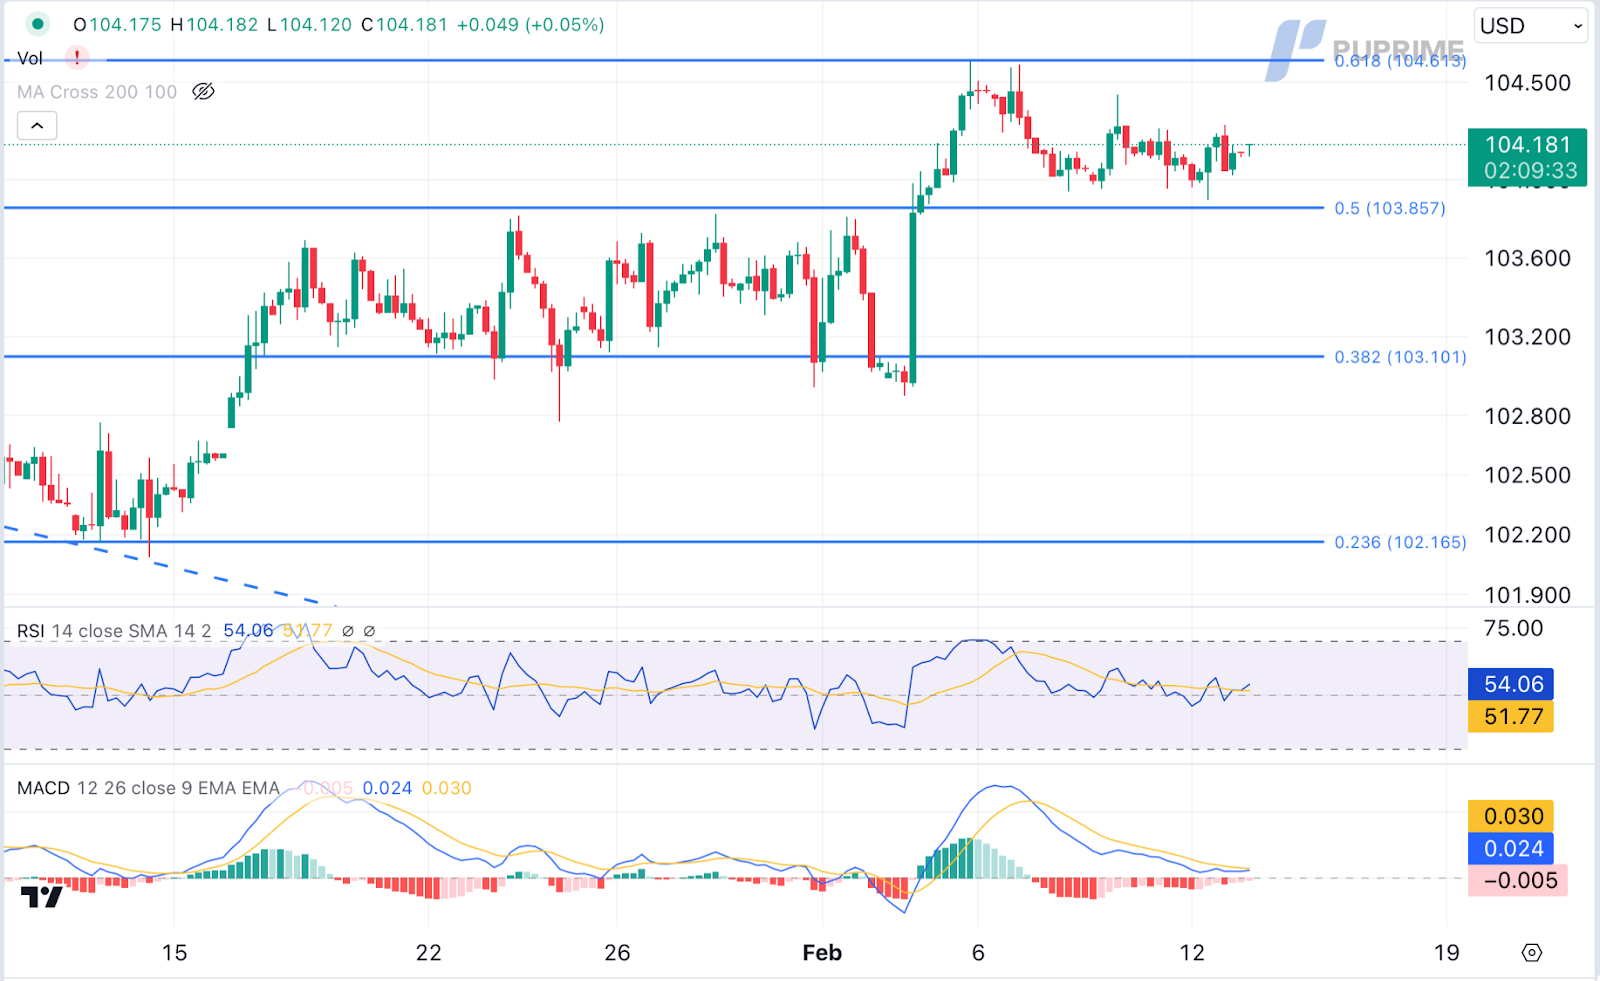
The Dollar Index is flat while currently testing the support level. However, MACD has illustrated diminishing bearish momentum, while RSI is at 54, suggesting the index might be traded higher since the RSI stays above the midline.
Resistance level: 104.65, 105.70
Support level: 103.85, 102.15
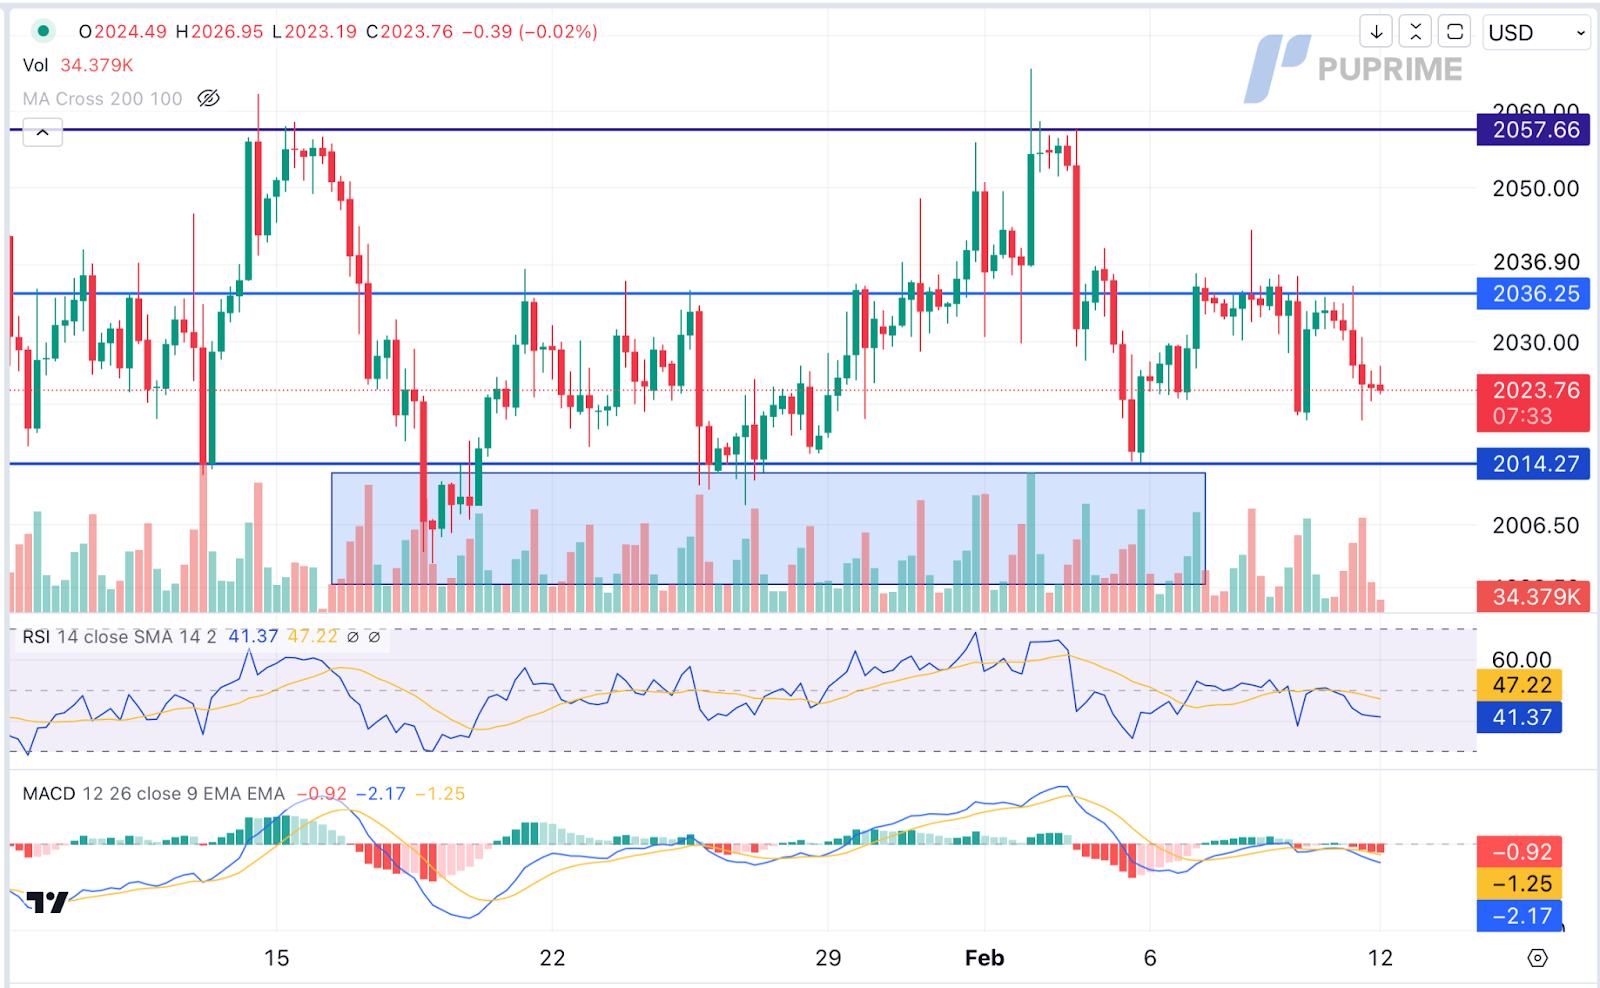
Gold prices remain in consolidation, finding support at various levels as investors eagerly await further fresh US economic data, particularly the upcoming release of US CPI data. This data, scheduled for later in the week, is expected to offer insights into the Federal Reserve’s potential decisions on interest rates, prompting investors to stay vigilant for evolving trading signals.
Gold prices are trading lower following the prior retracement from the resistance level. MACD has illustrated increasing bearish momentum, while RSI is at 41, suggesting the commodity might extend its losses toward support level since the RSI stays below the midline.
Resistance level: 2035.00, 2055.00
Support level: 2015.00, 2000.00
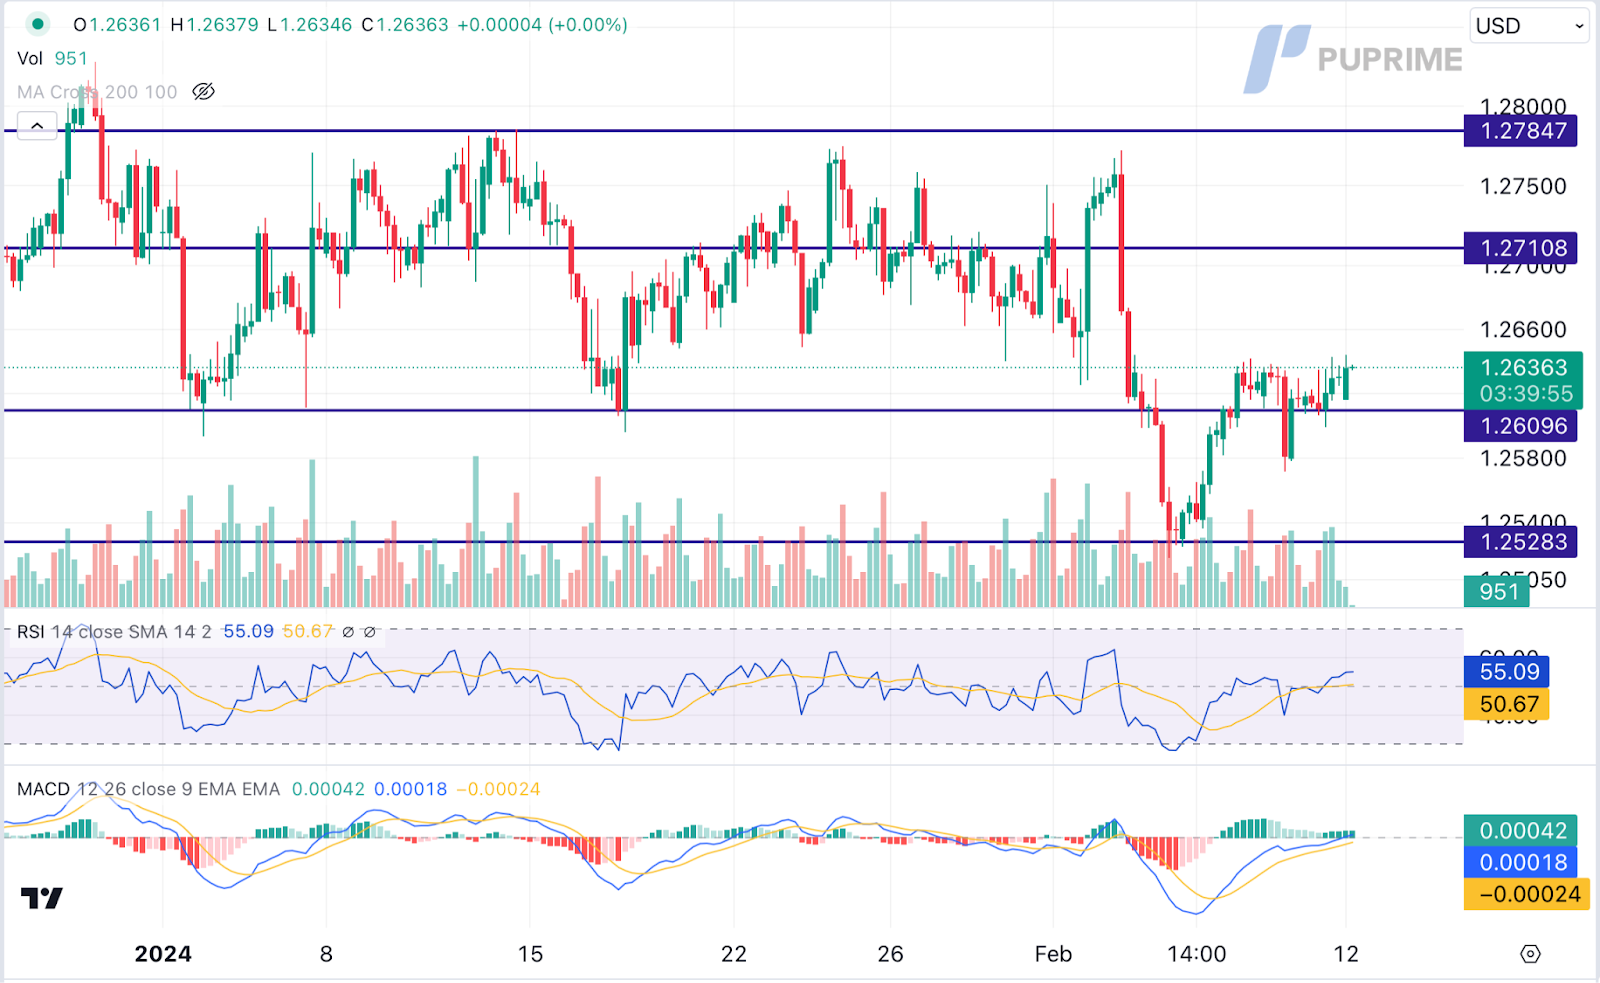
Despite a lack of impactful catalysts from the UK, Pound Sterling remains in a holding pattern, leaving investors searching for a clearer market direction. Bank of England Governor Andrew Bailey suggests a potential upturn in the economy in the long term, but highlights caution due to subdued trends in productivity and investment. To gauge the progress of the UK’s economic recovery, investors are urged to stay attuned to upcoming data releases for precise trading signals.
GBPUSD is trading higher following the prior breakout above the previous resistance level. MACD has illustrated increasing bullish momentum, while RSI is at 55, suggesting the pair might extend its gains since the RSI stays above the midline.
Resistance level: 1.2710, 1.2785
Support level:1.2610, 1.2530
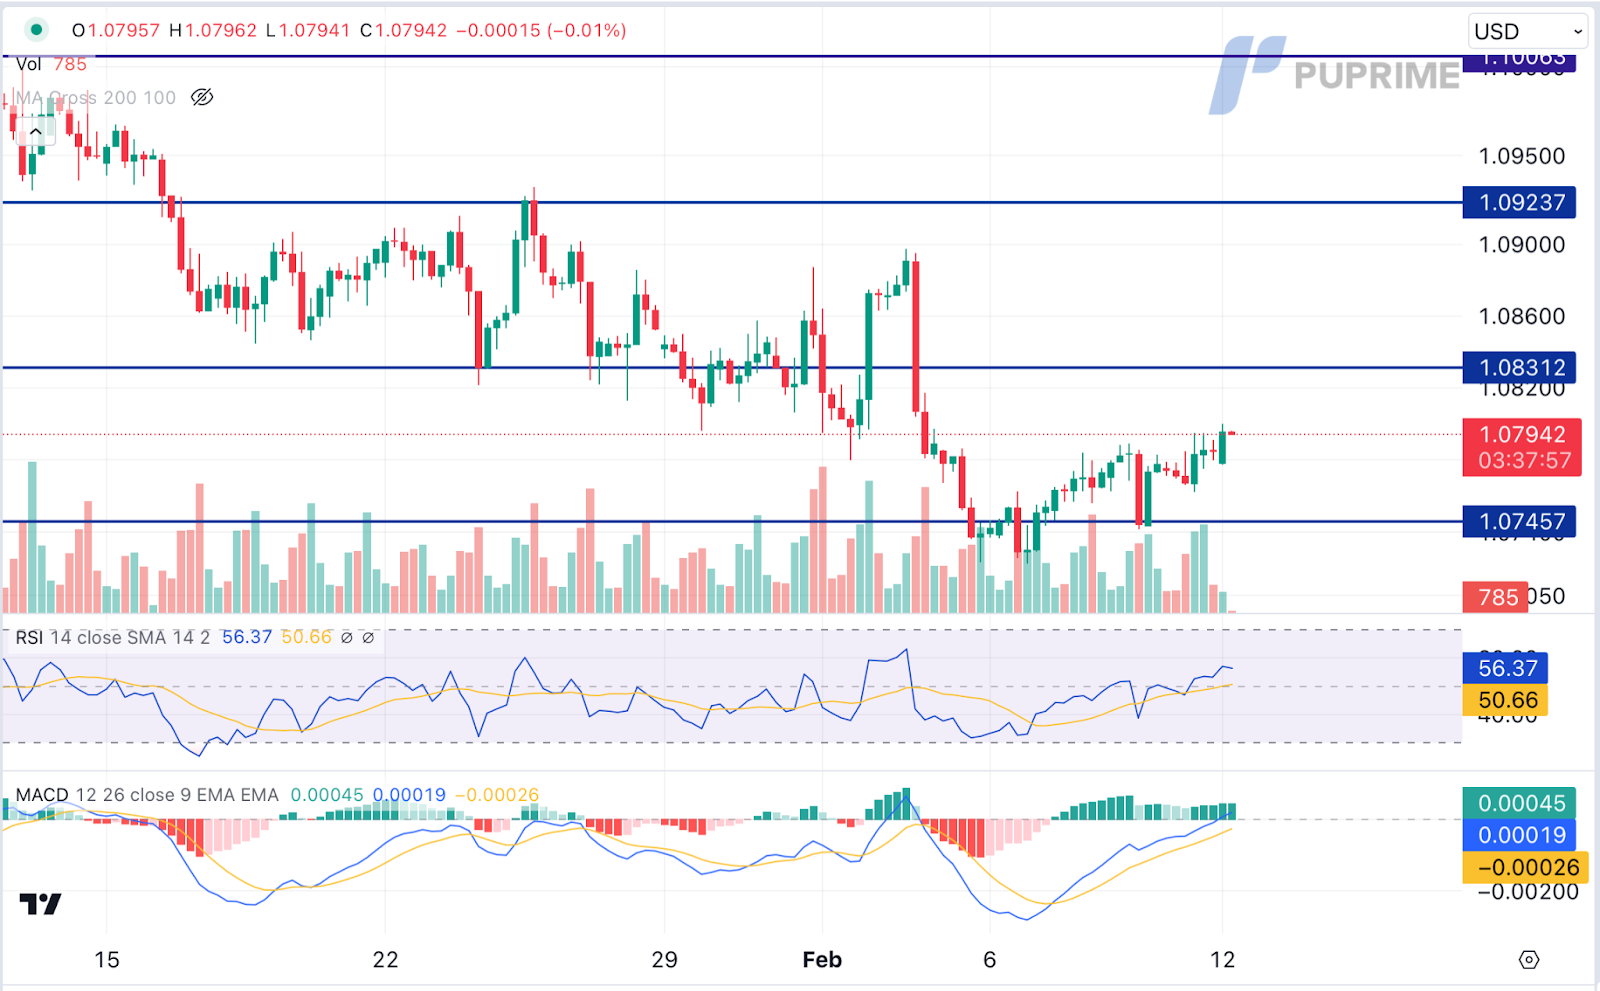
With a scarcity of Eurozone catalysts, the EUR/USD pair’s dynamics are influenced by a rebound in the US Dollar ahead of the crucial US inflation report. The absence of substantial market drivers from the Eurozone amplifies the impact of Dollar movements on the pair, prompting investors to closely monitor the unfolding developments in anticipation of clearer trading signals.
EUR/USD is trading higher following the prior rebound from the support level. MACD has illustrated increasing bullish momentum, while RSI is at 56, suggesting the pair might extend its gains since the RSI stays above the midline.
Resistance level: 1.0830, 1.0925
Support level: 1.0745, 1.0665
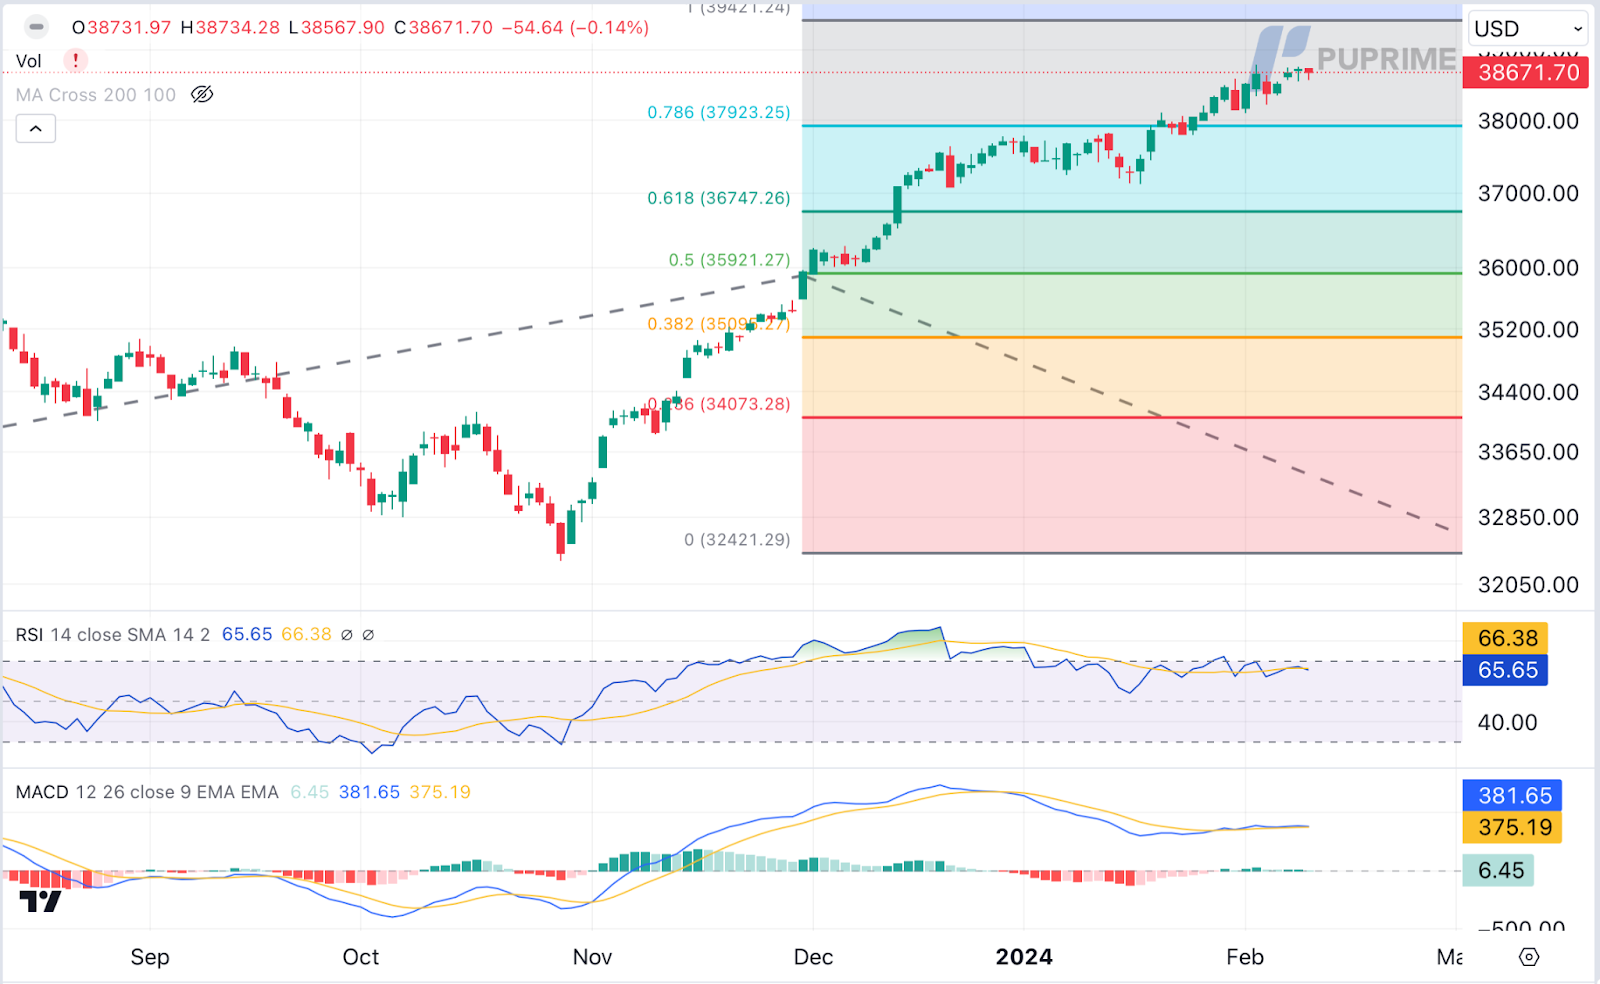
The US equity market experiences a slight dip from all-time highs as investors engage in profit-taking ahead of crucial economic data releases. Uncertainties loom over the impact of US inflation data, which could influence Federal Reserve decisions and, in turn, the attractiveness of the US equity market. Over recent months, megacaps with a focus on artificial intelligence have led a bullish trend on Wall Street.
Dow Jones is trading higher following the prior breakout above the resistance level. The RSI remains flowing in the upper region while the MACD hovers flat above the zero line, suggesting the index remains trading with strong bullish momentum.
Resistance level: 39420.00, 40000.00
Support level: 37925.00, 36745.00
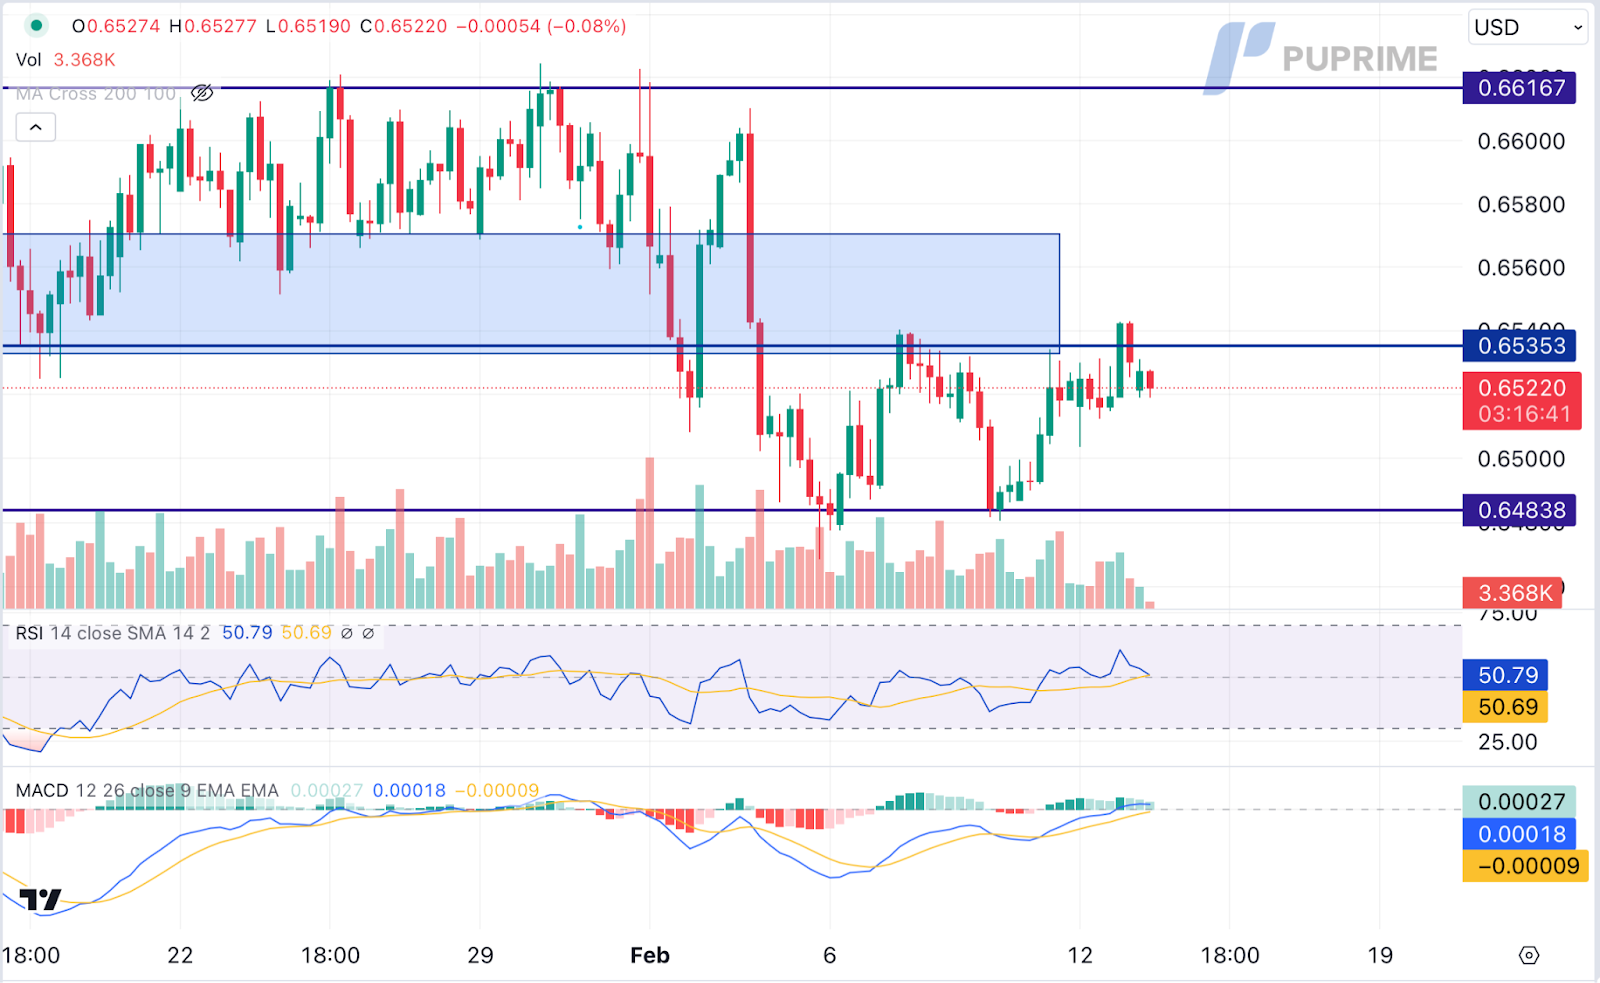
The Australian Dollar stands firm while testing the resistance level. The rise in Chinese New Loans acts as a supportive factor for the AUD/USD pair, demonstrating the intertwined nature of the Chinese and Australian economies. However, concerns about deflation in China pose a potential headwind for the pair. The Australian Dollar (AUD) is intricately connected to the economic developments in China, considering the substantial trade partnership between the two nations
AUD/USD is trading higher while currently testing the resistance level. However, MACD has illustrated diminishing bullish momentum, while RSI is at 51, suggesting the pair might experience technical correction since the RSi retreated sharply from overbought territory.
Resistance level: 0.6535, 0.6615
Support level: 0.6485, 0.6410
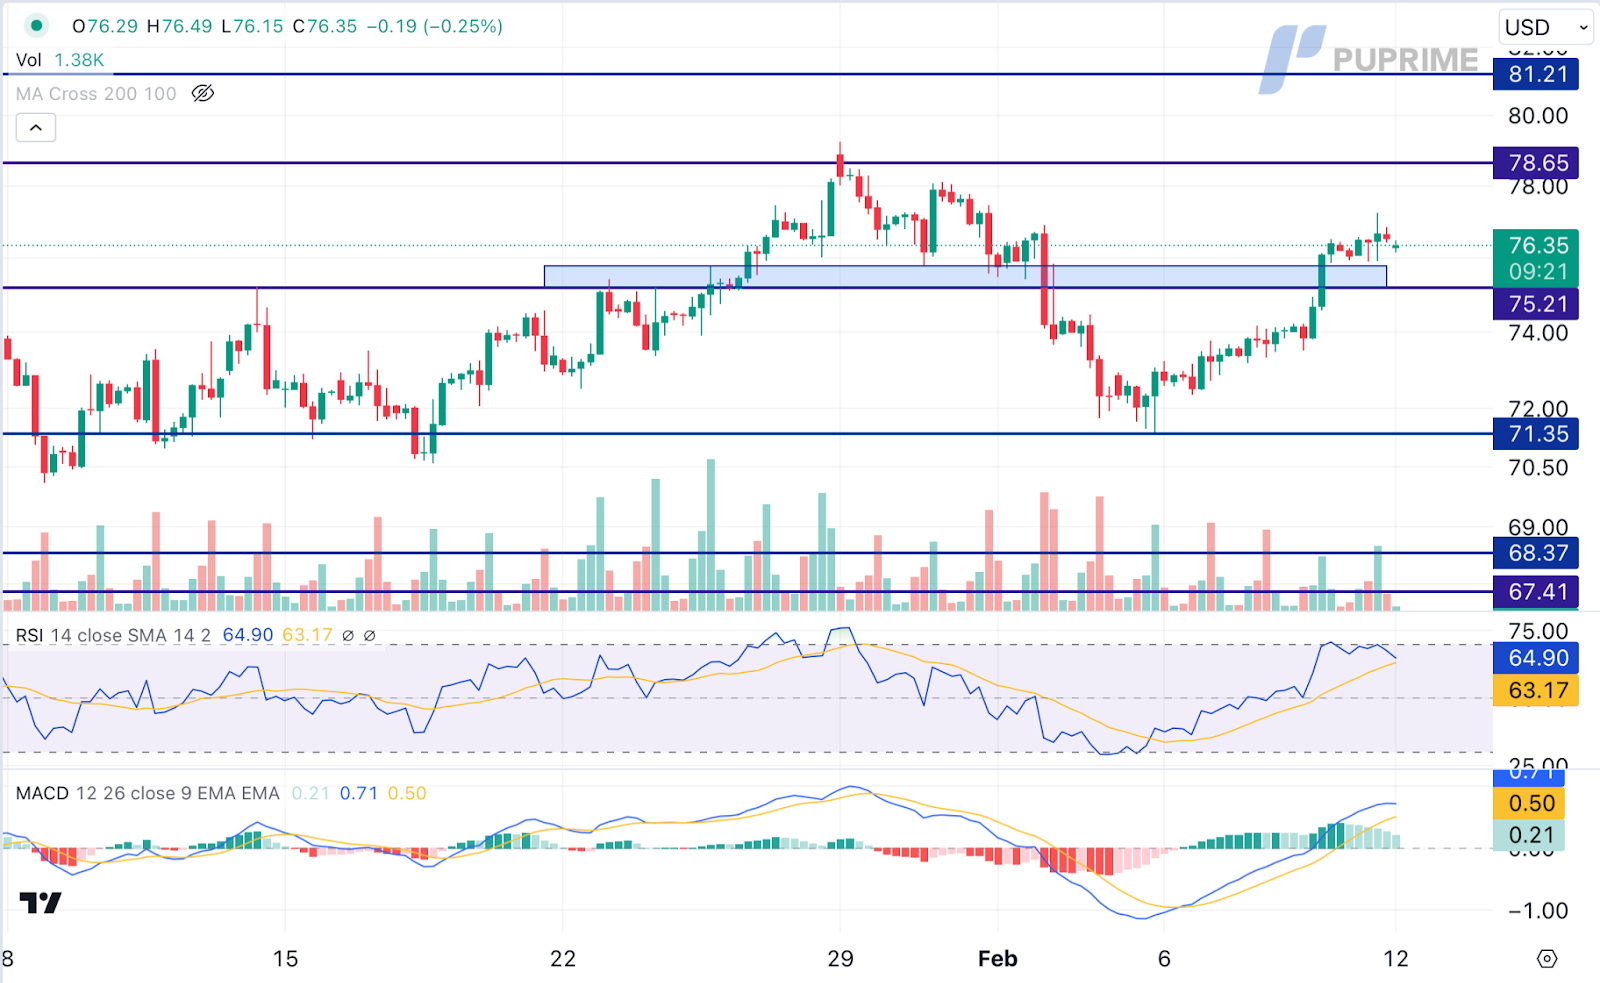
Persistent threats to shipping in the Red Sea, strikes on Russian refineries in Ukraine, and US refinery maintenance, spurring fears upon supply disruption, oil prices continue to rise. Ongoing geopolitical tensions, including the Israel-Hamas ceasefire negotiations, complicate the oil market outlook. Meanwhile, Iraq’s commitment to OPEC decisions and production limits adds another layer of influence to the evolving oil landscape.
Oil prices are trading higher following the prior breakout above the resistance level. However, MACD has illustrated diminishing bullish momentum, while RSI is at 65, suggesting the commodity might experience technical correction since the RSI retreated sharply from overbought territory.
Resistance level: 78.65, 81.20
Support level: 75.20, 71.35

Tradez le Forex, les indices, Métaux et plus encore avec des spreads faibles et une exécution ultra-rapide.
Inscrivez-vous pour un compte réel PU Prime grâce à notre procédure simplifiée.
Approvisionnez facilement votre compte grâce à un large éventail de canaux et de devises acceptées.
Accédez à des centaines d’instruments avec les meilleures conditions de trading.
Plateformes de trading
Apprendre
À propos de PU Prime
Corporatif

Please note the Website is intended for individuals residing in jurisdictions where accessing the Website is permitted by law.
Please note that PU Prime and its affiliated entities are neither established nor operating in your home jurisdiction.
By clicking the "Acknowledge" button, you confirm that you are entering this website solely based on your initiative and not as a result of any specific marketing outreach. You wish to obtain information from this website which is provided on reverse solicitation in accordance with the laws of your home jurisdiction.
Thank You for Your Acknowledgement!
Ten en cuenta que el sitio web está destinado a personas que residen en jurisdicciones donde el acceso al sitio web está permitido por la ley.
Ten en cuenta que PU Prime y sus entidades afiliadas no están establecidas ni operan en tu jurisdicción de origen.
Al hacer clic en el botón "Aceptar", confirmas que estás ingresando a este sitio web por tu propia iniciativa y no como resultado de ningún esfuerzo de marketing específico. Deseas obtener información de este sitio web que se proporciona mediante solicitud inversa de acuerdo con las leyes de tu jurisdicción de origen.
Thank You for Your Acknowledgement!
