


-
- Plateformes de trading
- Application PU Prime
- MetaTrader 5
- MetaTrader 4
- PU Copy Trading
- Trader Web
- PU Social
-
- Conditions de Trading
- Types de compte
- Spreads, Coûts et Swaps
- Dépôts et Retraits
- Frais et Charges
- Heures de Trading

20 February 2024,02:01
Daily Market Analysis
20 February 2024, 02:01


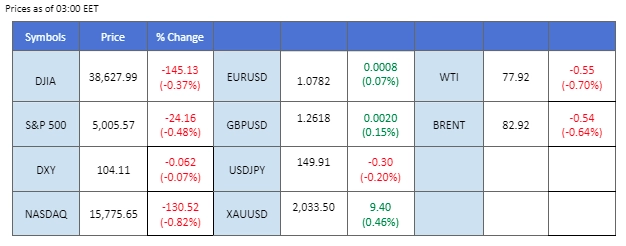
The US Dollar undergoes a notable retreat driven by profit-taking activities following recent gains, fueled by optimistic economic data
The US Dollar undergoes a notable retreat driven by profit-taking activities following recent gains, fueled by optimistic economic data suggesting a delay in Federal Reserve interest rate cuts. Despite the pullback, the dollar’s overall resilience remains intact, buoyed by a robust labor market and stronger-than-expected economic growth. Gold prices surge above $2,000 per troy ounce, driven by geopolitical uncertainties in the Middle East and bargain buying from investors. Meanwhile, China’s equity market anticipates post-Lunar New Year positivity amid positive travel and tourism data, signalling a short-term revival. Crude oil prices surge amidst heightened Middle East tensions, although tempered by a cautious demand outlook from the International Energy Agency. Investors remain vigilant, awaiting signals from upcoming Fed meeting minutes and Nvidia’s earnings report for further market direction.
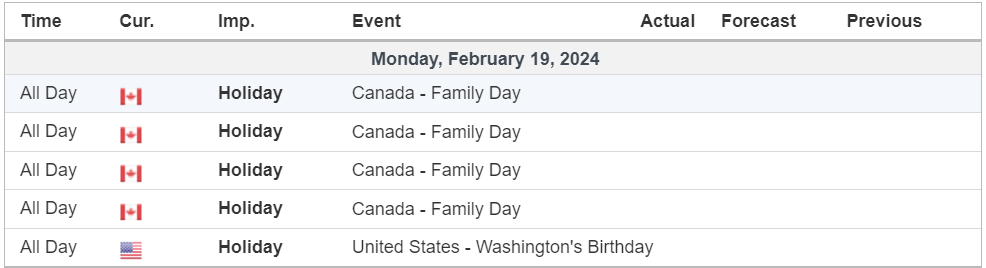
Current rate hike bets on 20th March Fed interest rate decision:
Source: CME Fedwatch Tool
0 bps (89.5%) VS -25 bps (10.5%)
(MT4 System Time)
Source: MQL5
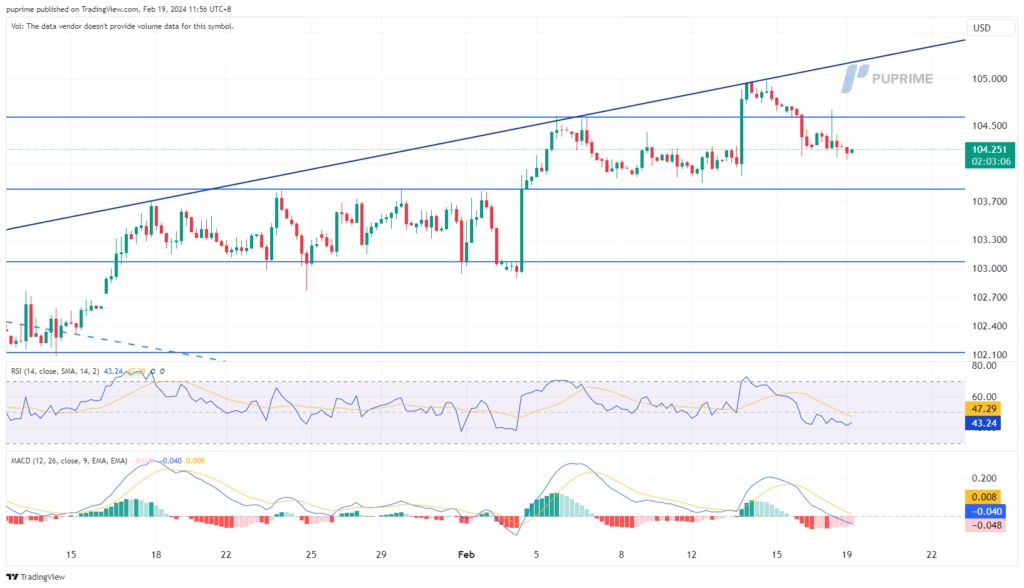
The US Dollar undergoes a technical correction, pulling back from recent significant gains as investors take-profit. The market digests better-than-expected US economic data, notably higher producer prices, fueling expectations of a delayed interest rate cut by the Federal Reserve until at least mid-year. Despite a healthy retracement, the overall trend for the US Dollar remains robust, supported by a resilient labor market and stronger-than-expected economic growth.
The Dollar Index is trading lower following the prior breakout below the previous support level. MACD has illustrated increasing bearish momentum, while RSI is at 41, suggesting the index might extend its losses since the RSI stays below the midline.
Resistance level: 104.60, 105.70
Support level: 103.85, 103.05
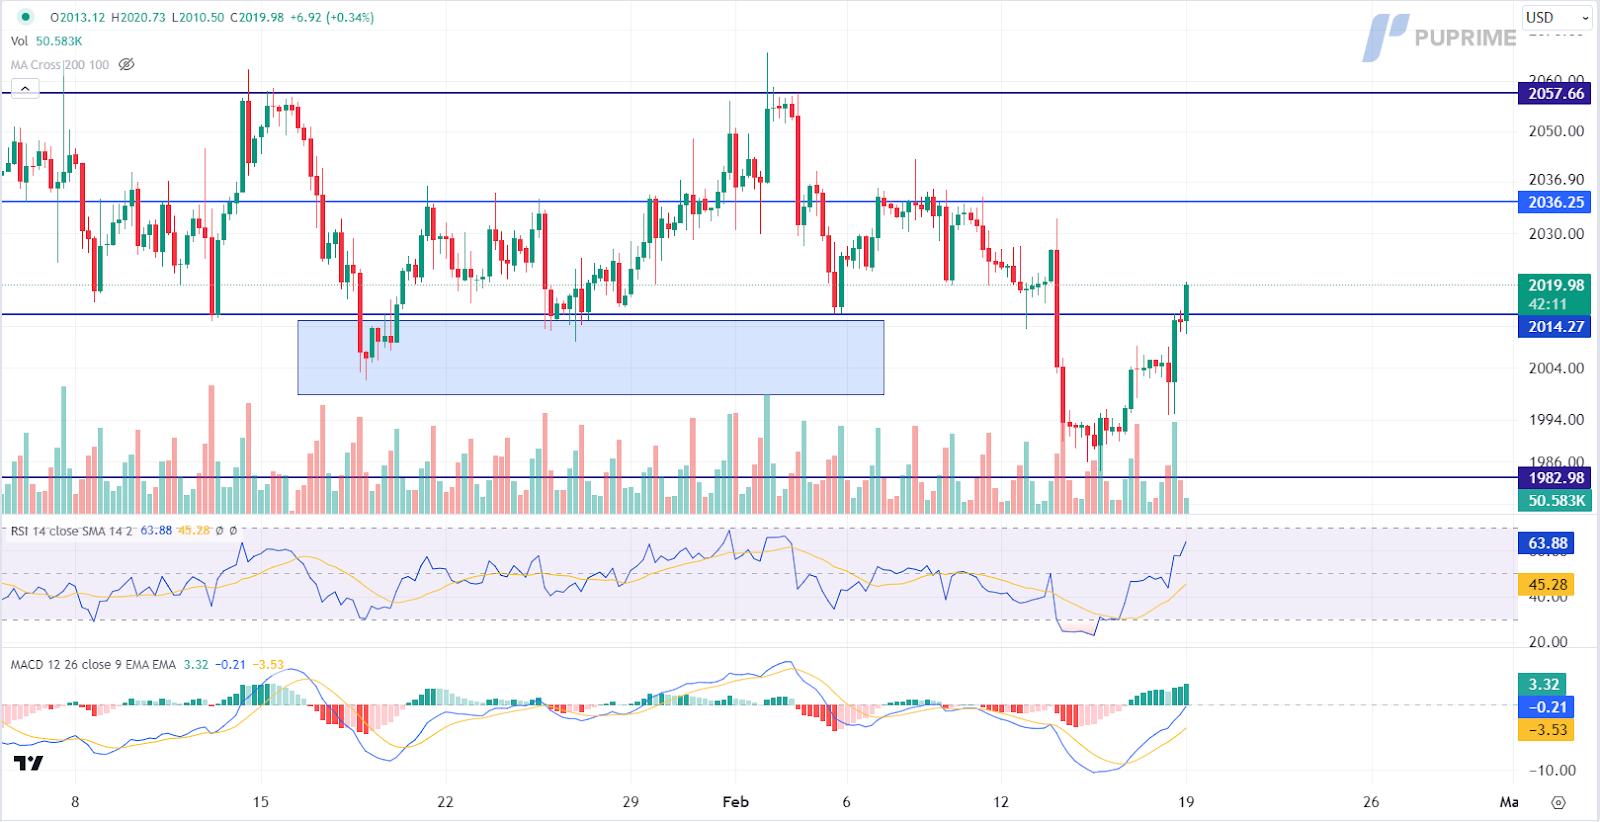
Gold prices extend gains, breaking above the psychologically significant level of $2,000 per troy ounce for the second consecutive session. Bargain buying from global investors bolsters the overall bullish momentum, despite a dim outlook for the dollar-denominated gold. Ongoing geopolitical uncertainties in the Middle East continue to elevate gold’s status as a safe-haven asset, prompting investors to monitor both Middle East developments and Fed meeting minutes for trading signals.
Gold prices are trading higher following the prior breakout above the previous resistance level. MACD has illustrated increasing bullish momentum, while RSI is at 63, suggesting the commodity might extend its gains since the RSI stays above the midline.
Resistance level: 2020.00, 2035.00
Support level: 2015.00, 1985.00
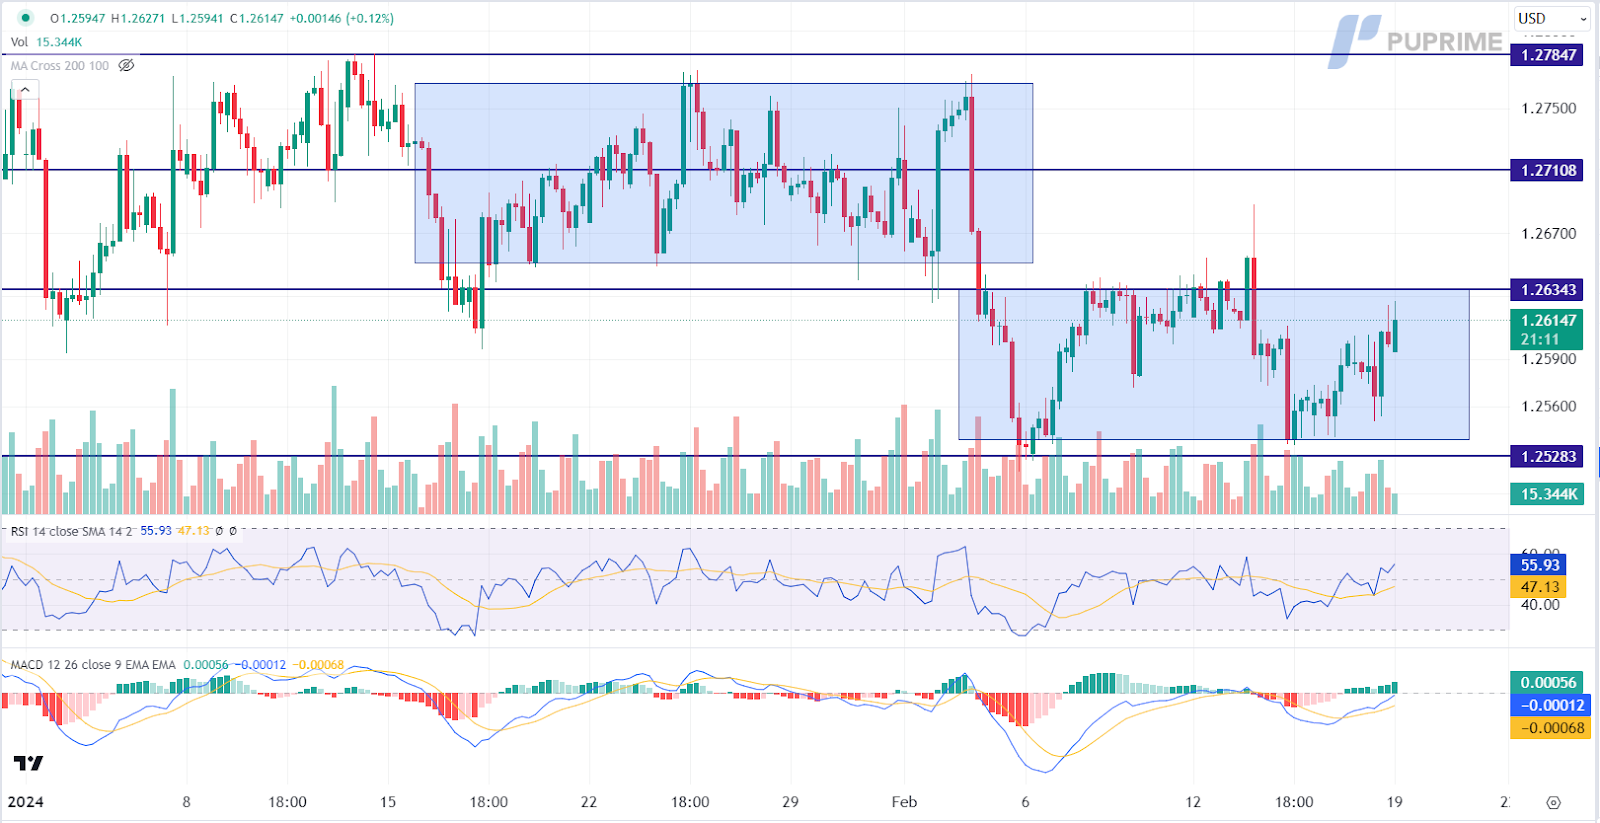
Pound Sterling sees a robust surge, propelled by better-than-expected UK retail sales, marking the largest monthly rise in almost three years. The 3.40% gain in January, the most since April 2021, offers a glimmer of hope for the UK economy’s recovery after facing a recession last year. The rebound provides relief to the retail sector, signalling a potential turnaround after a challenging December that contributed to a shallow recession. This positive trend aligns with survey evidence indicating an uptick in economic momentum amid easing cost-of-living pressures.
GBP/USD is trading higher while currently near the resistance level. MACD has illustrated increasing bullish momentum, while RSI is at 56, suggesting the pair might extend its gains after breakout since the RSI stays above the midline.
Resistance level: 1.2635, 1.2710
Support level:1.2530, 1.2435
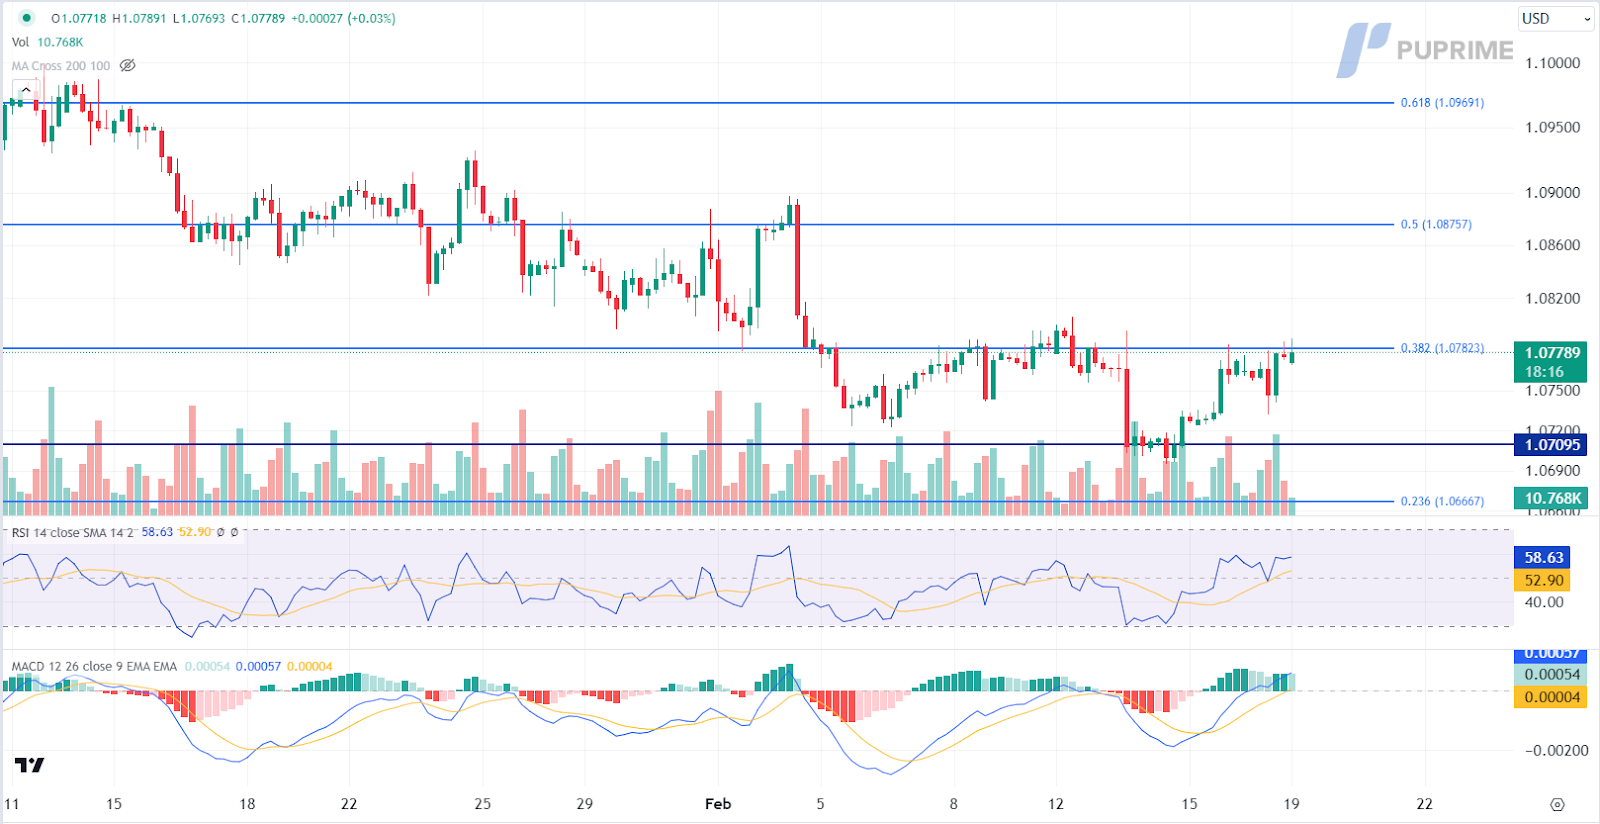
The EUR/USD pair experiences momentum driven primarily by the depreciation of the US Dollar, given the absence of significant market catalysts from the Eurozone. Investors opt for profit-taking on the US Dollar following a series of crucial economic data releases. Looking ahead, market participants are advised to closely monitor additional economic data from the Eurozone and scrutinise the Federal Reserve meeting minutes for potential trading signals in the currency pair.
EUR/USD is trading higher while currently testing the resistance level. MACD has illustrated increasing bullish momentum, while RSI is at 59, suggesting the pair might extend its gains after breakout since the RSI stays above the midline.
Resistance level: 1.0780, 1.0875
Support level: 1.0710, 1.0665
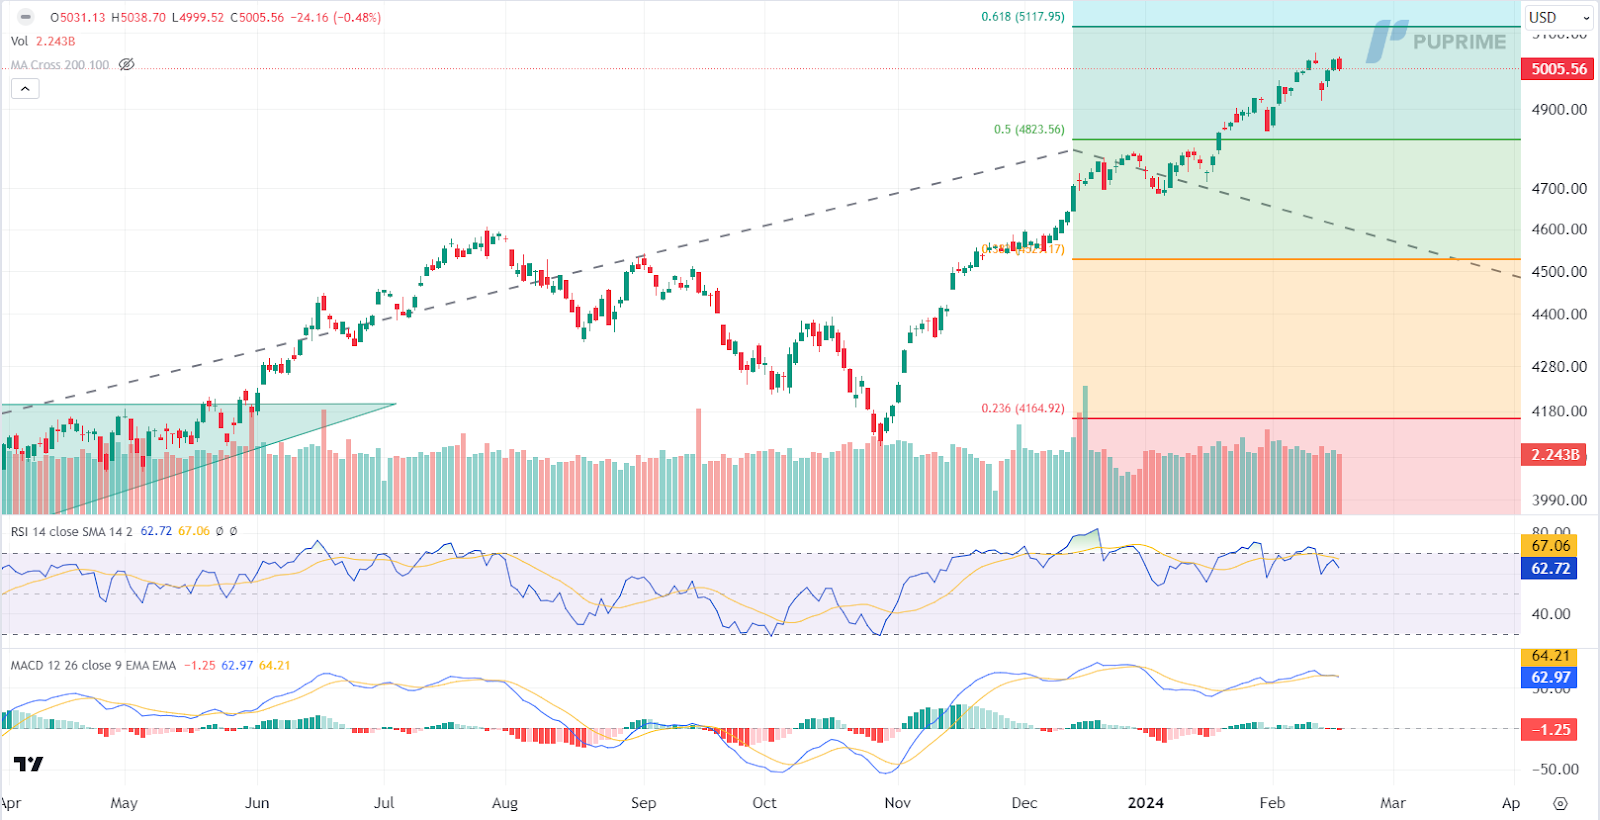
The US equity market maintains positivity as the S&P 500 surpasses the crucial 5,000 level, leading Goldman Sachs Group Inc. strategists to revise forecasts upward. The bullish outlook stems from aggressive rate cut expectations by the Federal Reserve and better-than-expected financial results from major corporations. Eyes are on Nvidia’s upcoming earnings as a pivotal test of market sentiment given its prominent role in the Artificial Intelligence sector.
S&P 500 is trading higher following the prior breakout above the previous resistance level. However, MACD has illustrated increasing bearish momentum, while RSI is at 63, suggesting the index might experience technical correction since the RSI retreated sharply from overbought territory.
Resistance level: 5115.00, 5535.00
Support level: 4825.00, 4530.00
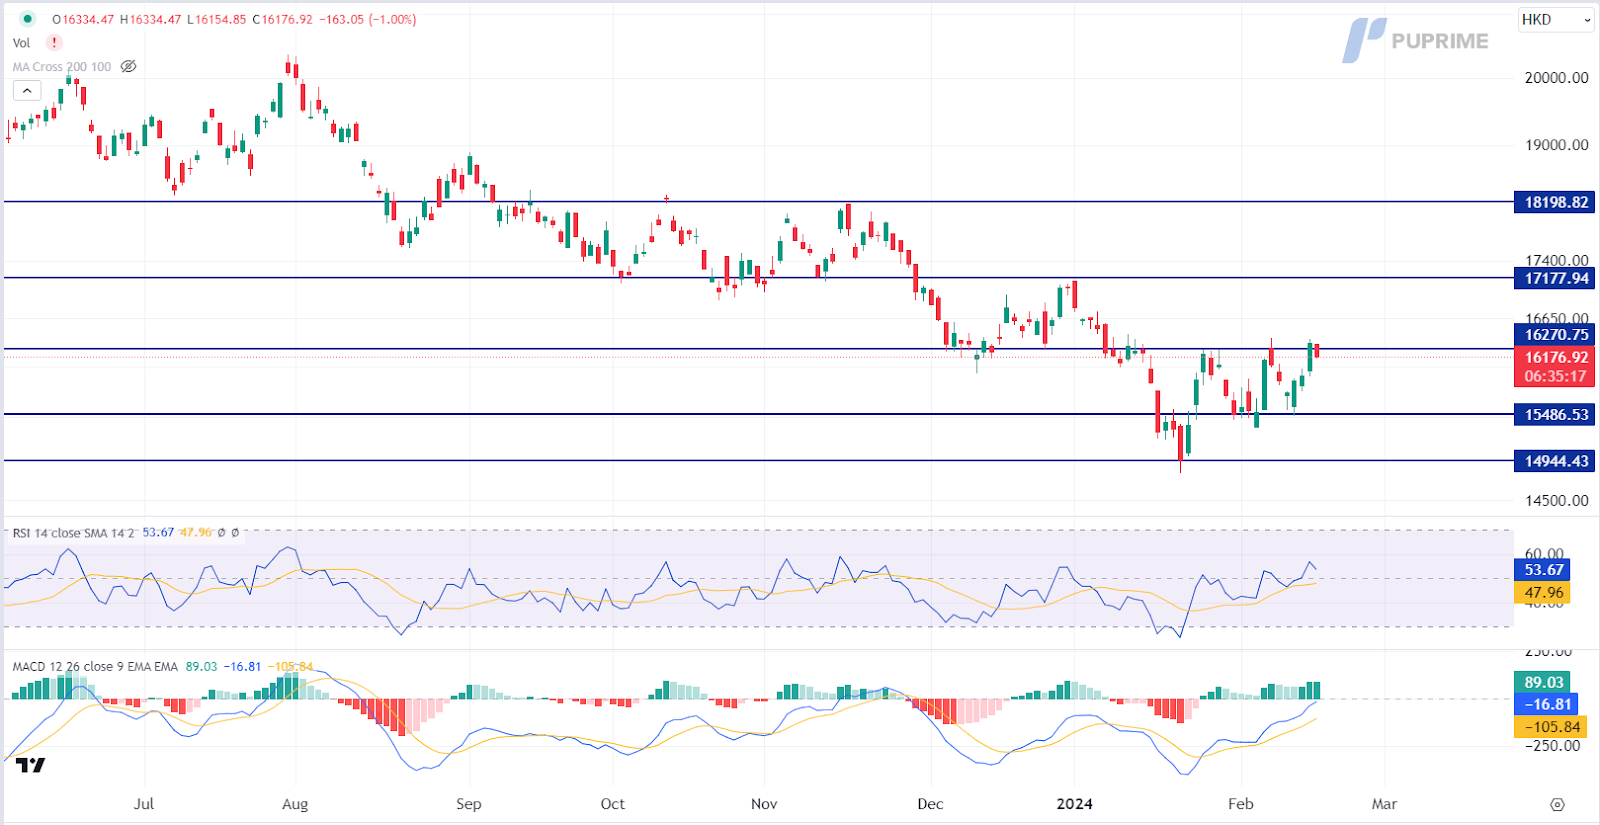
With onshore traders returning from the Lunar New Year break, China’s equity market anticipates a positive trend. Positive travel and tourism data provide relief for the Chinese economy, drawing cues from gains in offshore-listed shares. The holiday season’s consumption patterns signal a revival even amid broader economic challenges, with market watchers expecting a short-term boost and authorities aiming to bolster investor confidence.
HK50 is trading higher while currently testing the resistance level. MACD has illustrated increasing bullish momentum, while RSI is at 53, suggesting the index might extend its gains after breakout since the RSI stays above the midline.
Resistance level: 16270.00, 17180.00
Support level: 15485.00, 14945.00
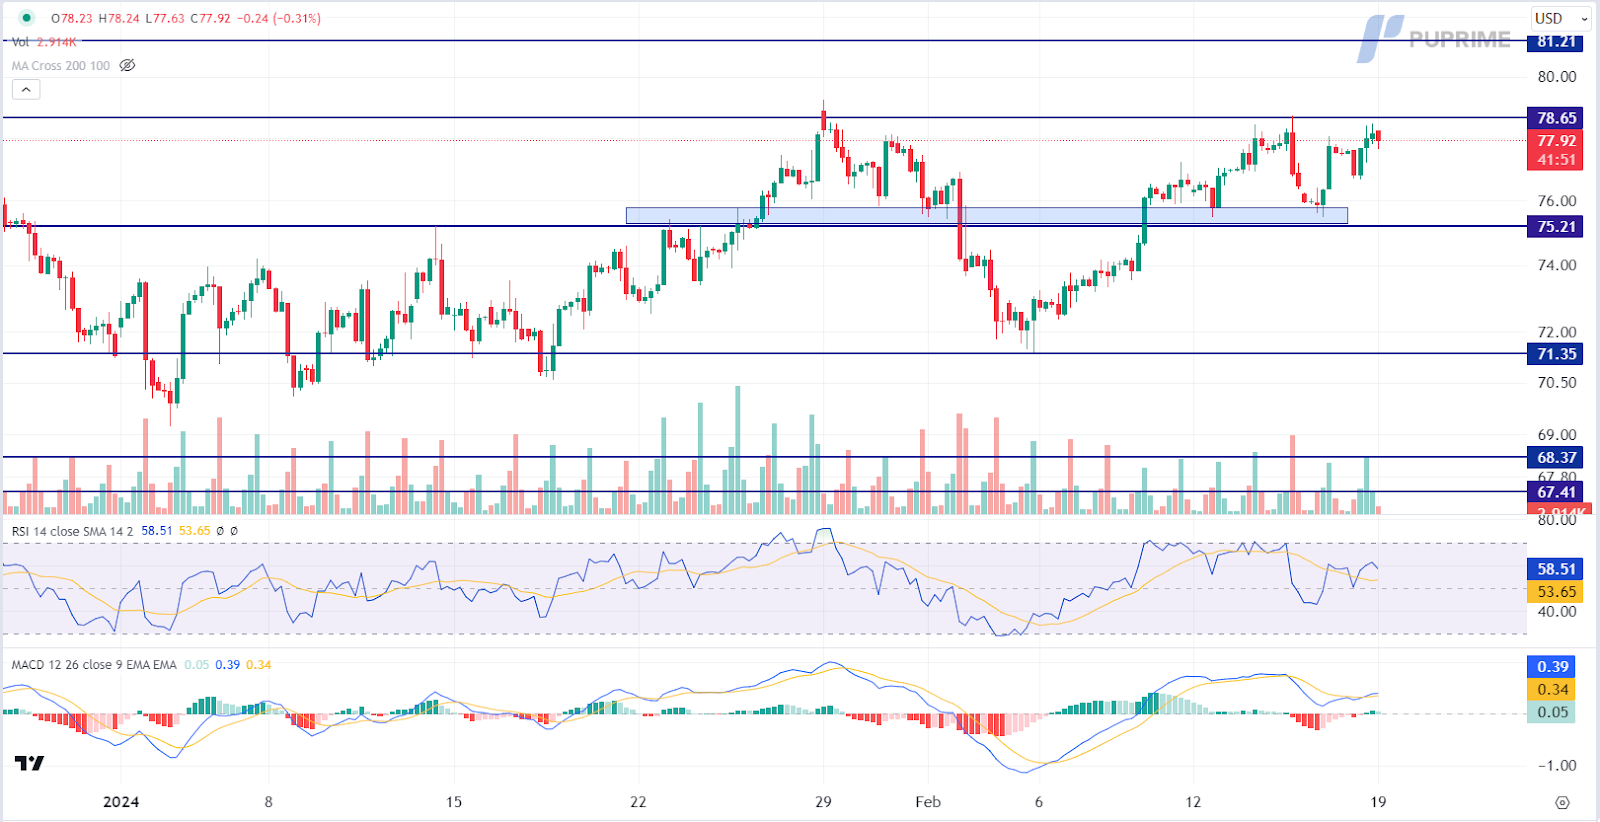
Crude oil prices are continuing their upward trajectory, supported by heightened geopolitical tensions in the Middle East. Recent incidents in the Red Sea, such as a missile strike on an India-bound tanker from Yemen, contribute to the uncertainties surrounding oil supply routes in the region. However, despite the geopolitical concerns driving optimism in oil markets, there is a tempering effect on sentiment due to a pessimistic demand forecast from the International Energy Agency (IEA). The IEA has trimmed its 2024 growth outlook, citing the potential loss of momentum in global oil demand.
Oil prices are trading at their recent high levels but kept below its strong resistance level at $78.65. The RSI has been flowing at the elevated levels while the MACD hovering at above the zero line suggest the bullish momentum remain strong.
Resistance level: 78.65, 81.20
Support level: 75.20, 71.35

Tradez le Forex, les indices, Métaux et plus encore avec des spreads faibles et une exécution ultra-rapide.
Inscrivez-vous pour un compte réel PU Prime grâce à notre procédure simplifiée.
Approvisionnez facilement votre compte grâce à un large éventail de canaux et de devises acceptées.
Accédez à des centaines d’instruments avec les meilleures conditions de trading.
Plateformes de trading
Apprendre
À propos de PU Prime
Corporatif

Please note the Website is intended for individuals residing in jurisdictions where accessing the Website is permitted by law.
Please note that PU Prime and its affiliated entities are neither established nor operating in your home jurisdiction.
By clicking the "Acknowledge" button, you confirm that you are entering this website solely based on your initiative and not as a result of any specific marketing outreach. You wish to obtain information from this website which is provided on reverse solicitation in accordance with the laws of your home jurisdiction.
Thank You for Your Acknowledgement!
Ten en cuenta que el sitio web está destinado a personas que residen en jurisdicciones donde el acceso al sitio web está permitido por la ley.
Ten en cuenta que PU Prime y sus entidades afiliadas no están establecidas ni operan en tu jurisdicción de origen.
Al hacer clic en el botón "Aceptar", confirmas que estás ingresando a este sitio web por tu propia iniciativa y no como resultado de ningún esfuerzo de marketing específico. Deseas obtener información de este sitio web que se proporciona mediante solicitud inversa de acuerdo con las leyes de tu jurisdicción de origen.
Thank You for Your Acknowledgement!
