


-
- Plateformes de trading
- Application PU Prime
- MetaTrader 5
- MetaTrader 4
- PU Copy Trading
- Trader Web
- PU Social
-
- Conditions de Trading
- Types de compte
- Spreads, Coûts et Swaps
- Dépôts et Retraits
- Frais et Charges
- Heures de Trading

29 avril 2024,06:05
Analyse quotidienne du marché
29 avril 2024, 06:05


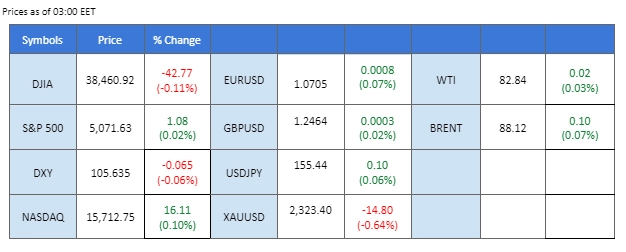
The U.S. equity markets saw a halt in their two-day rally, primarily pulled down by disappointing earnings from Meta Platforms. As a result, both the Nasdaq and S&P 500 were left nearly unchanged, while the Dow Jones Industrial Average closed lower. Market focus is now turning to Alphabet and Microsoft, whose earnings reports are due later today and are anticipated to influence market movements significantly.
On the currency front, the dollar experienced a slight recovery from just below the $106 mark. Investors are now keenly awaiting today’s U.S. GDP data, which is expected to provide further insights into the dollar’s trajectory. In Japan, the yen continues to struggle, breaking past the significant psychological resistance level of 155 against the dollar. Japanese officials have reiterated their readiness to take necessary measures to address the rapid depreciation of the yen, increasing the risk of potential market intervention.
In commodities, gold prices moved sideways, stabilising after a slight rebound in the previous session after the dollar gained in strength. Meanwhile, oil prices were buoyed by a notable decline in U.S. crude stockpiles, with WTI crude trading above the $83 mark.
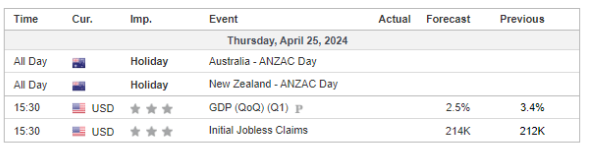
Les paris actuels sur la hausse des taux d'intérêt se poursuivent 1er mai Décision sur les taux d'intérêt de la Fed:
Source : Outil Fedwatch du CME
0 bps (97%) VS -25 bps (3%)
(Heure du système MT4)
Source : MQL5
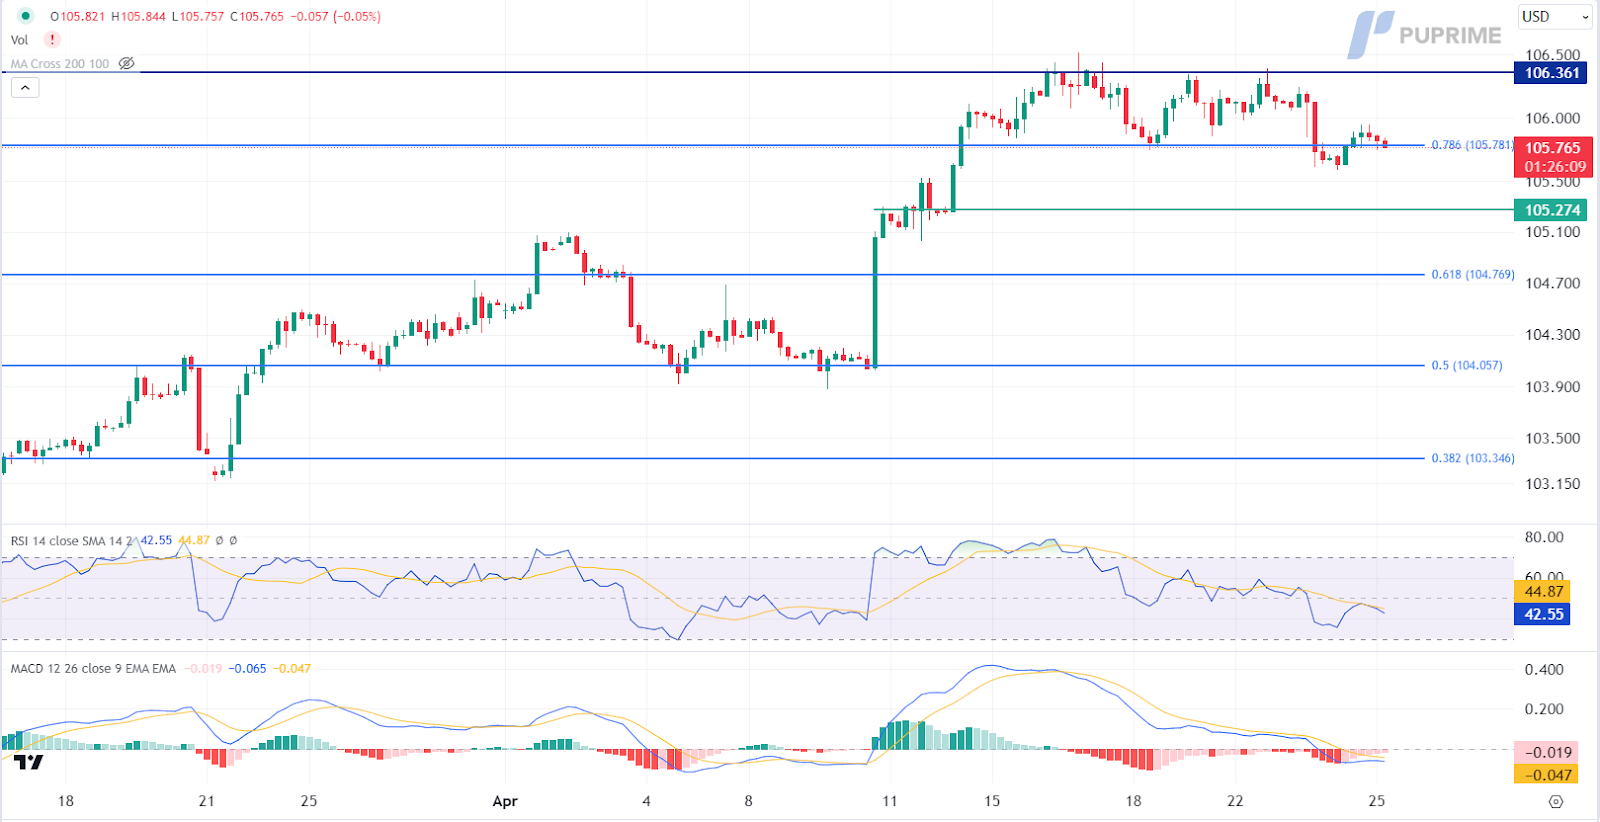
Despite upbeat Durable Goods Orders data, the Dollar Index only experienced bullish momentum slightly as investors awaited key economic indicators, including US GDP and Initial Jobless Claims reports. Anticipation surrounding these releases kept market participants on edge, with economists forecasting a potential decline in GDP from 3.4% to 2.5%. Continued monitoring of economic data performance is advised for traders seeking further trading signals.
The Dollar Index is trading flat while currently testing the support level. MACD has illustrated diminishing bearish momentum, while RSI is at 42, suggesting the index might have experienced technical correction since the RSI rebounded sharply from oversold territory.
Resistance level: 106.35, 107.05
Support level: 105.80, 105.25
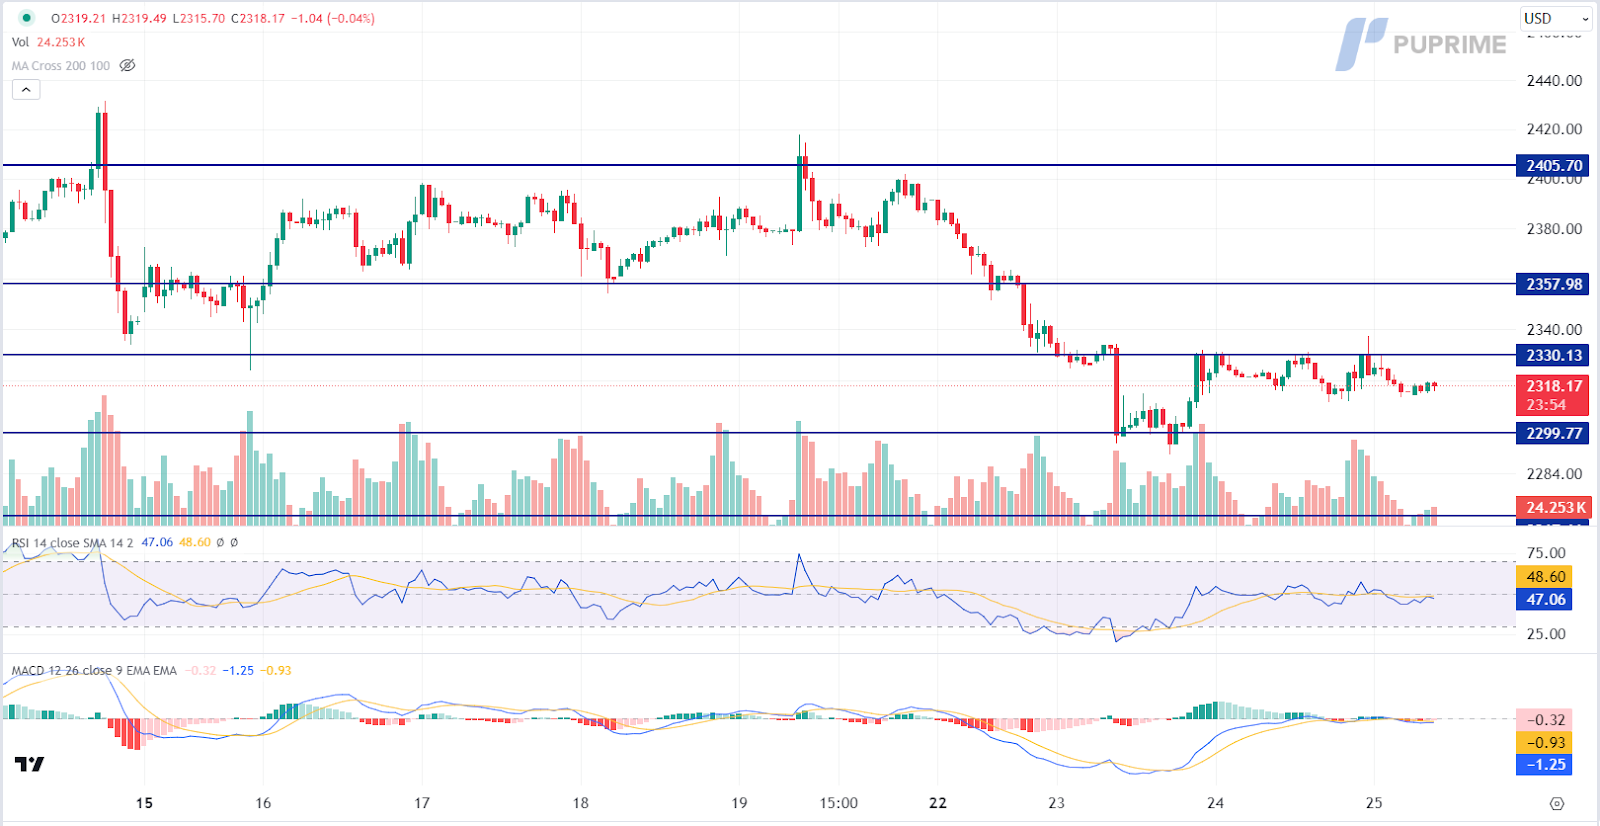
Gold prices saw a slight retreat following better-than-expected Core Durable Goods Orders from the US, which bolstered dollar demand and dampened the appeal for dollar-denominated gold. Additionally, easing tensions in the Middle East contributed to a shift in investor sentiment towards riskier assets, including the US equity market. Attention remains focused on upcoming economic releases, such as US GDP, Initial Jobless Claims, and Core PCE Price Index, for potential market-moving insights.
Gold prices are trading lower following the prior retracement from the resistance level. MACD has illustrated increasing bearish momentum, while RSI is at 47, suggesting the commodity might extend its losses in short-term since the RSI stays below the midline.
Niveau de résistance : 2330,00, 2360,00
Niveau de support : 2300.00, 2270.00
The GBP/USD pair has settled within its previous price consolidation range, fluctuating between 1.2480 and 1.2430, following a technical rebound from its recent low. Sterling’s resilience stemmed from upbeat PMI readings released earlier in the week. However, the pair is likely to be influenced by the upcoming U.S. GDP data scheduled for release later today.
The GBP/USD pair traded sideways in the past session, awaiting a catalyst to pick a direction. However, the RSI has rebounded and is close to the overbought zone, while the MACD has broken above the zero line, suggesting the pair is currently trading with bullish momentum.
Niveau de résistance : 1,2540, 1,2660
Support level: 1.2370, 1.2260
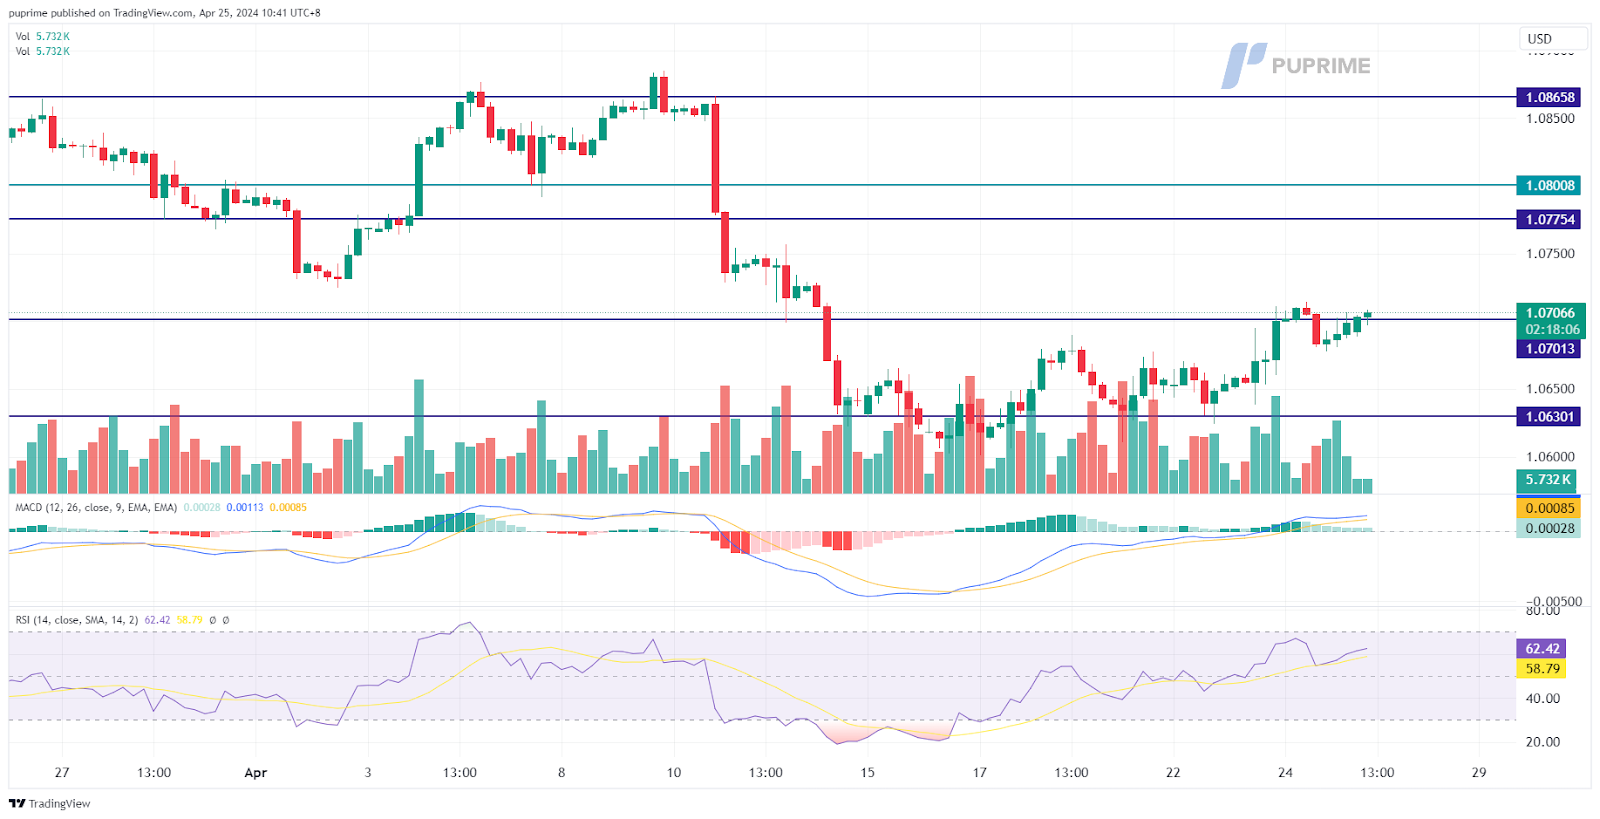
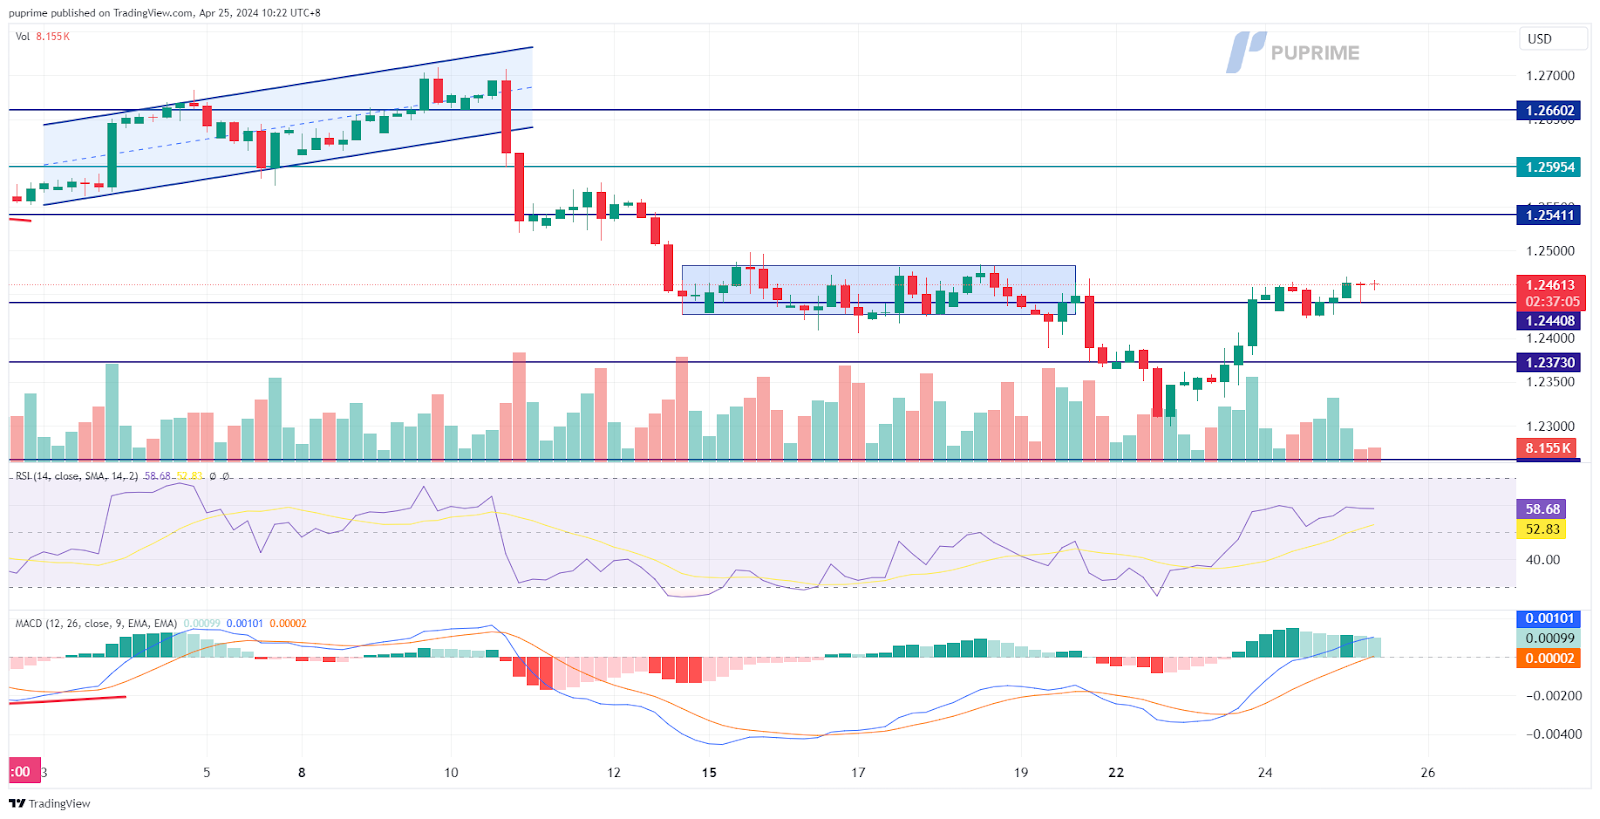
The EUR/USD pair remained relatively subdued following its recent rally, trading within a narrow range. Against the backdrop of speculation regarding an early rate cut by the ECB due to the euro’s CPI nearing its targeted inflation rate, market participants are closely monitoring today’s U.S. GDP data to assess the pair’s potential trajectory.
The pair is currently facing a strong resistance level at 1.0710. A break above this level suggests a solid bullish signal for the pair. The MACD is currently hovering above the zero line, while the RSI is on the brink of getting into the overbought zone, suggesting the bullish momentum remains strong.
Resistance level: 1.0775, 1.0866
Support level: 1.0630, 1.0560
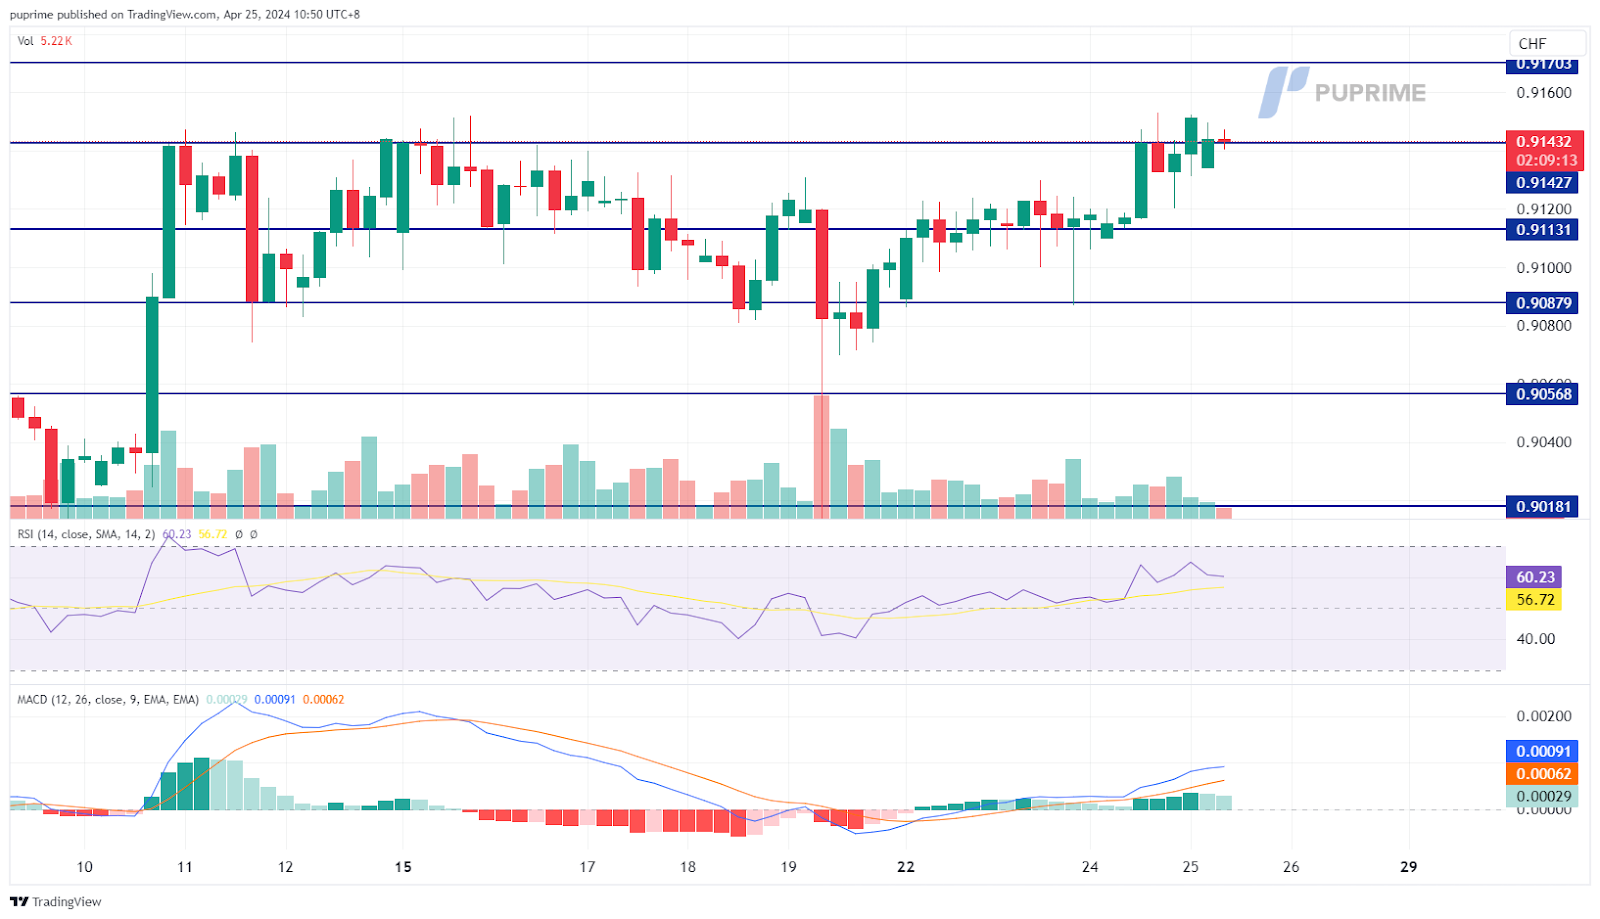
The USD/CHF pair has been approaching its significant resistance level at 0.9145. The Swiss National Bank (SNB) was among the first major central banks to commence a rate-cutting cycle, a move that has weighed on the Swiss Franc. Concurrently, the better-than-expected performance of the U.S. economy has bolstered the dollar, contributing to the bullish momentum in the pair.
The USD/CHF is poised at its highest level since last October. A break above this level will be a solid bullish signal for the pair. The RSI has been gaining, while the MACD shows signs of rebounding from above the zero line, suggesting that the bullish momentum remains strong.
Resistance level: 0.9170, 0.9195
Support level: 0.9120, 0.9090
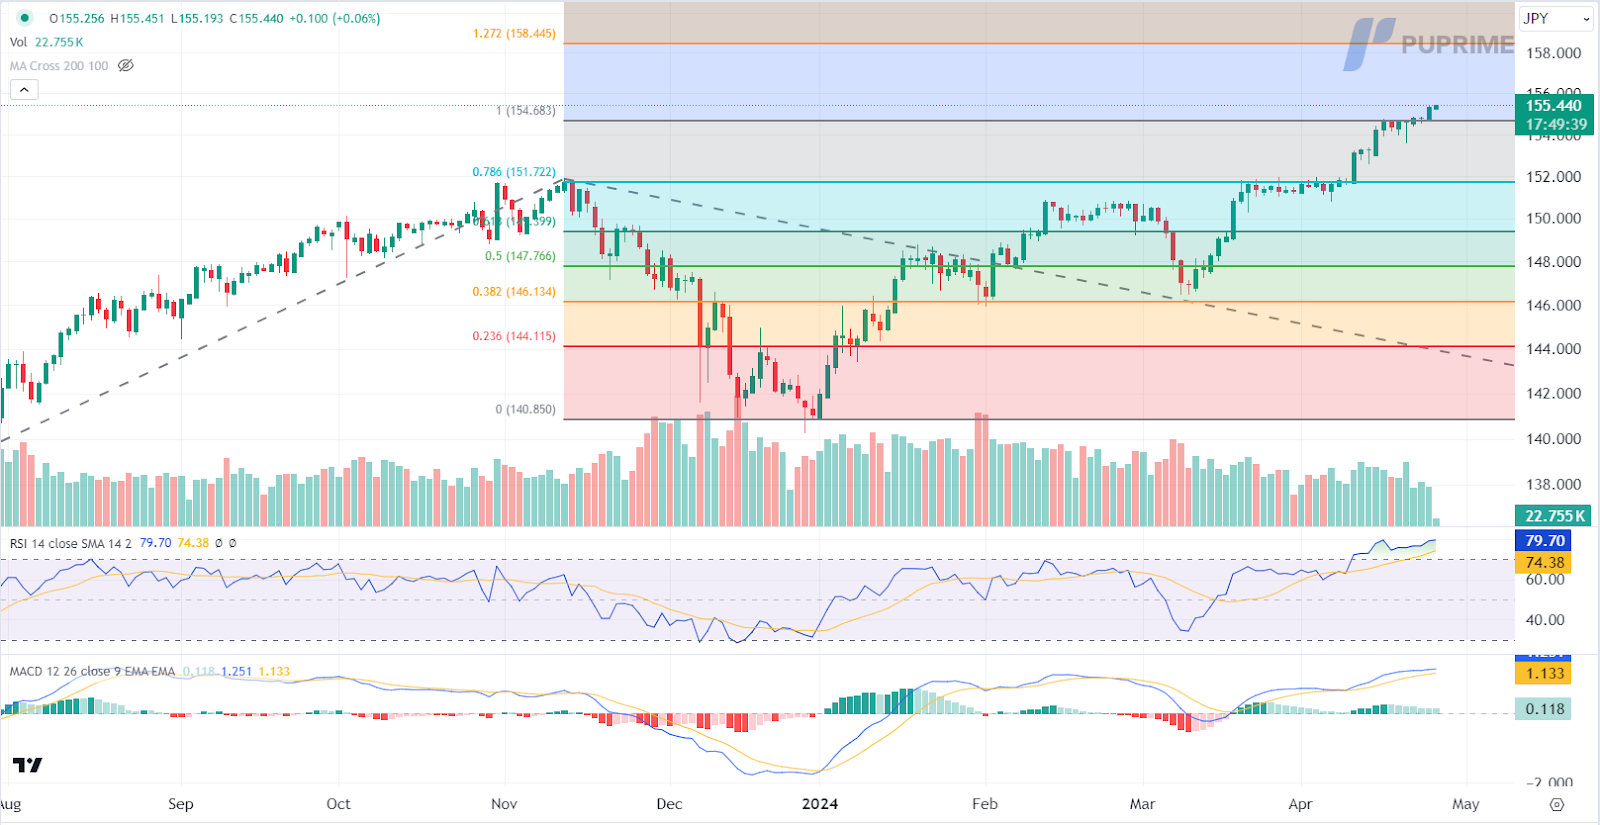
The Japanese yen slumped to its weakest levels against the US dollar since 1990, driven by a string of positive US economic data releases. The widening yield differential between Japan and the US, fueled by higher US Treasury yields, further pressured the yen. While Japanese authorities have indicated vigilance regarding currency movements and potential interventions, lack of concrete actions disappointed yen traders, who remain alert to any signs of intervention.
USD/JPY is trading higher following the prior breakout above the previous resistance level. However, MACD has illustrated diminishing bullish momentum, while RSI is at 80, suggesting the pair might enter overbought territory.
Resistance level: 158.45, 160.00
Support level: 154.70, 151.70
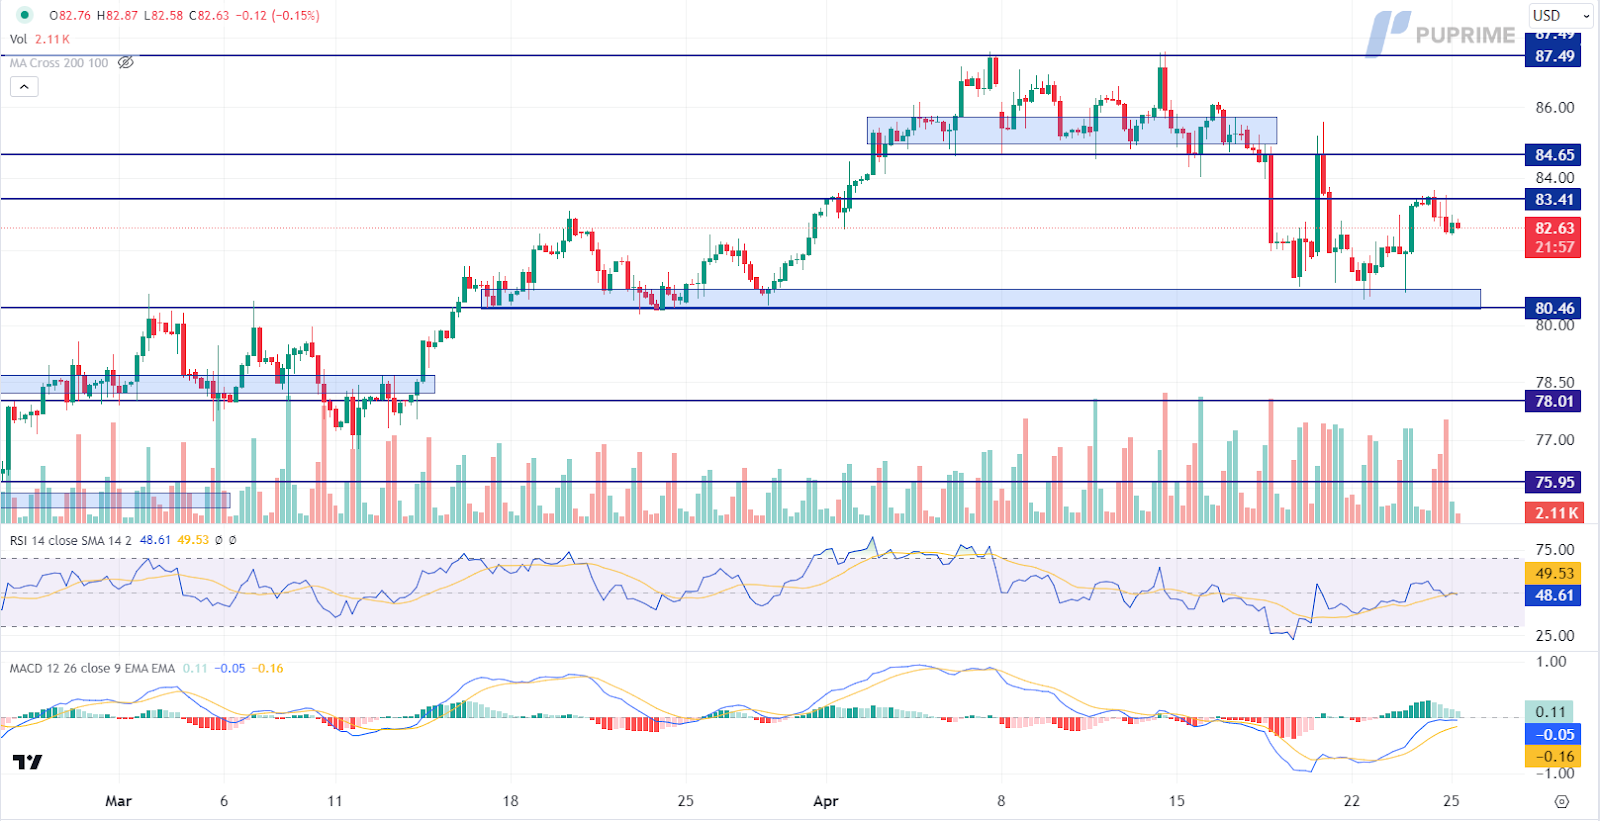
Oil prices settled slightly lower amidst cooling tensions in the Middle East, reducing concerns of supply disruptions. Despite a significant decline in US crude inventories, exceeding market expectations, weaker gasoline demand weighed on oil prices. The Energy Information Administration’s report revealed a sharp drop of 6.4 million barrels in US oil inventories, yet the reduction failed to offset the impact of decreased gasoline demand, highlighting ongoing market challenges.
Oil prices are trading lower following the prior retracement from the resistance level. MACD has illustrated diminishing bullish momentum, while RSI is at 48, suggesting the commodity might extend its losses since the RSI stays below the midline.
Resistance level: 83.40, 84.65
Support level: 80.45, 78.00

Tradez le Forex, les indices, Métaux et plus encore avec des spreads faibles et une exécution ultra-rapide.
Inscrivez-vous pour un compte réel PU Prime grâce à notre procédure simplifiée.
Approvisionnez facilement votre compte grâce à un large éventail de canaux et de dispositifs acceptés.
Accédez à des centaines d'instruments avec les meilleures conditions de trading.
Plateformes de trading
Apprendre
À propos de PU Prime
Corporatif

Veuillez noter que le site web est destiné aux personnes résidant dans des juridictions où l'accès au site web est autorisé par la loi.
Veuillez noter que PU Prime et ses entités affiliées ne sont ni établies ni actives dans votre juridiction nationale.
En cliquant sur le bouton "Accuser réception", vous confirmez que vous accédez à ce site web uniquement de votre propre initiative et non à la suite d'une démarche commerciale spécifique. Vous souhaitez obtenir des informations à partir de ce site web, qui sont fournies sur la base d'une sollicitation inversée, conformément aux lois en vigueur dans votre pays.
Merci de votre reconnaissance !
Il convient de noter que le site web est destiné aux personnes résidant dans des juridictions où l'accès au site web est autorisé par la loi.
Tenez compte du fait que PU Prime et ses entités affiliées ne sont pas établies et n'opèrent pas dans votre juridiction d'origine.
En cliquant sur le bouton "Accepter", vous confirmez que vous entrez sur ce site web de votre propre initiative et non à la suite d'un quelconque effort de marketing spécifique. Vous souhaitez obtenir des informations sur ce site web qui sont fournies par le biais d'une demande inversée conformément aux lois de votre juridiction d'origine.
Merci de votre reconnaissance !
