


-
- Plateformes de trading
- Application PU Prime
- MetaTrader 5
- MetaTrader 4
- PU Copy Trading
- Trader Web
- PU Social
-
- Conditions de Trading
- Types de compte
- Spreads, Coûts et Swaps
- Dépôts et Retraits
- Frais et Charges
- Heures de Trading

26 juin 2024,06:08
Analyse quotidienne du marché
26 juin 2024, 06:08


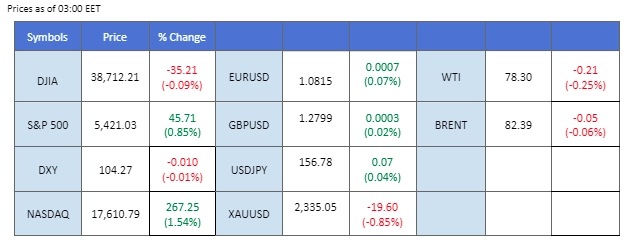
The financial markets experienced significant fluctuations in the last session, driven by two major economic events. Firstly, the U.S. CPI came in lower than market consensus, indicating easing inflation and boosting risk appetite. However, later in the session, the FOMC announced that there will be only one interest rate cut this year, reinforcing the Fed’s commitment to keeping borrowing costs high for longer to curb inflation. This hawkish stance caused the dollar index to rebound.
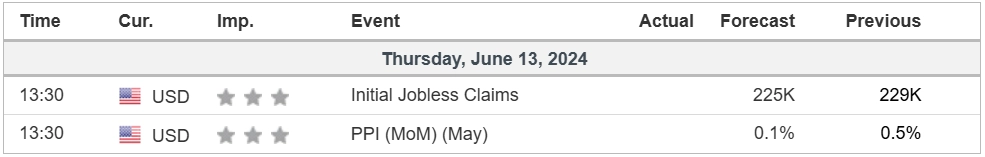
U.S. dollar traders are now focusing on today’s U.S. Initial Jobless Claims to gauge the dollar’s direction. Following the CPI reading, most currencies gained against the U.S. dollar, with the Pound Sterling and New Zealand dollar trading at recent highs. Additionally, Australian job data exceeded market expectations, showing higher employment changes and a slight improvement in the unemployment rate, which provided buoyancy for the Aussie dollar.
In the commodity markets, gold prices formed a false breakout pattern amid mixed economic signals, while oil prices edged lower due to a larger-than-expected crude stockpile build-up and the Fed’s hawkish monetary policy stance.
Les paris actuels sur la hausse des taux d'intérêt se poursuivent 12 juin Décision sur les taux d'intérêt de la Fed:
Source : Outil Fedwatch du CME
0 bps (99.4%) VS -25 bps (0.6%)
(Heure du système MT4)
Source : MQL5
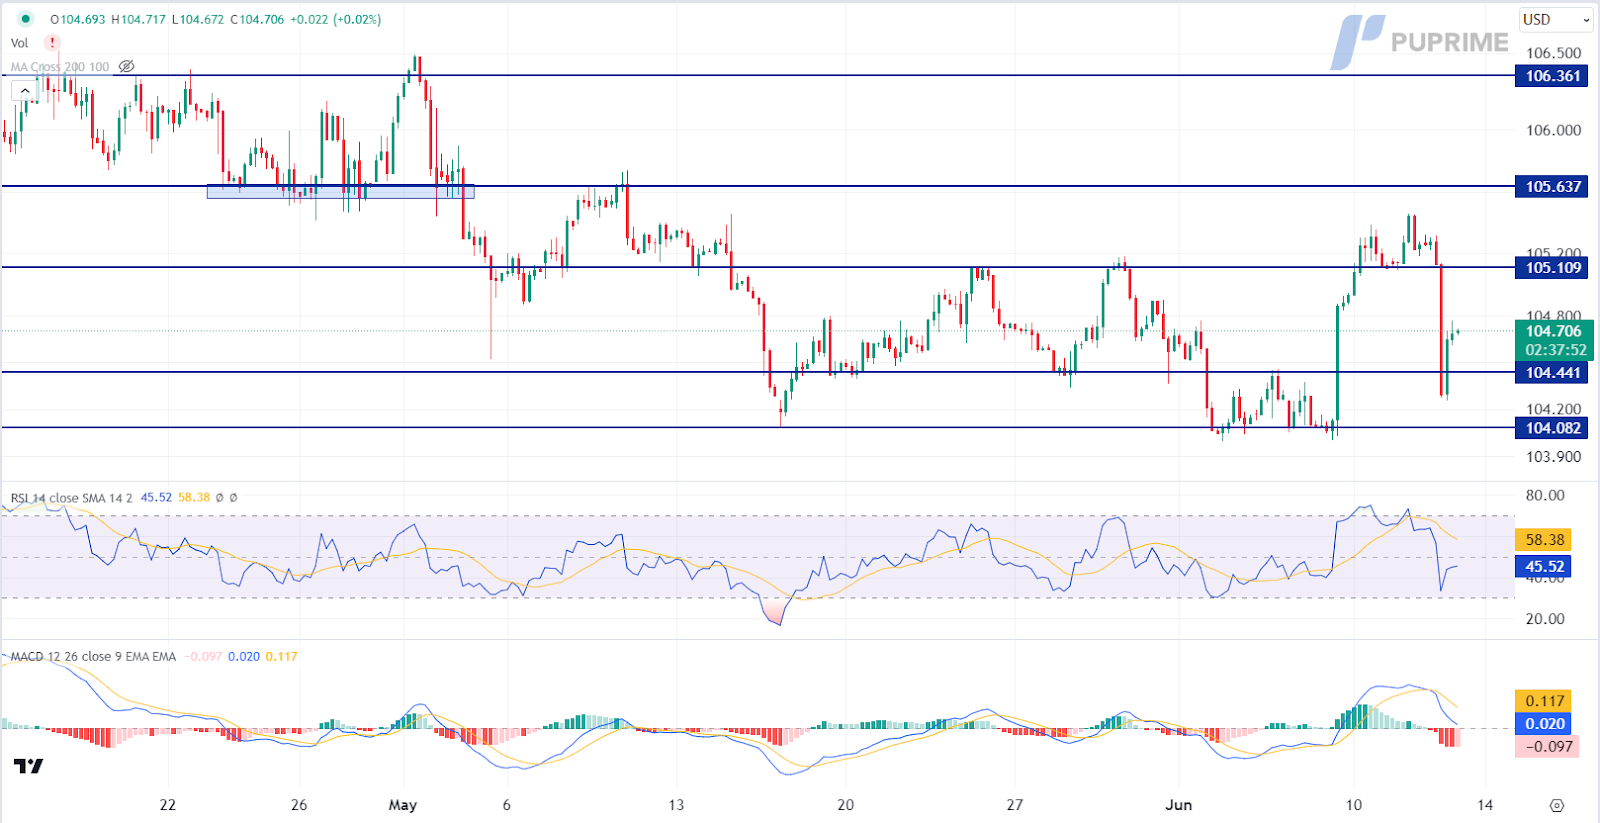
The Dollar Index, which tracks the greenback against a basket of six major currencies, dipped aggressively following the Federal Open Market Committee (FOMC) meeting. Investors are digesting the dovish stance from the Federal Reserve, which held interest rates steady at 5.25% to 5.5% and revised its outlook for rate cuts in 2024. No members of the Monetary Policy Committee (MPC) voted to raise rates, citing concerns that continued restrictive policy could jeopardise economic growth. Additionally, Fed Chair Jerome Powell suggested that recent strong jobs data might be slightly “overstated,” indicating potential benchmark revisions.
The Dollar Index is trading lower while currently near the support level. However, MACD has illustrated diminishing bearish momentum, while RSI is at 47, suggesting the index might experience technical correction since the RSI rebounded sharply from oversold territory.
Resistance level: 105.10, 105.65
Support level: 104.45, 104.10
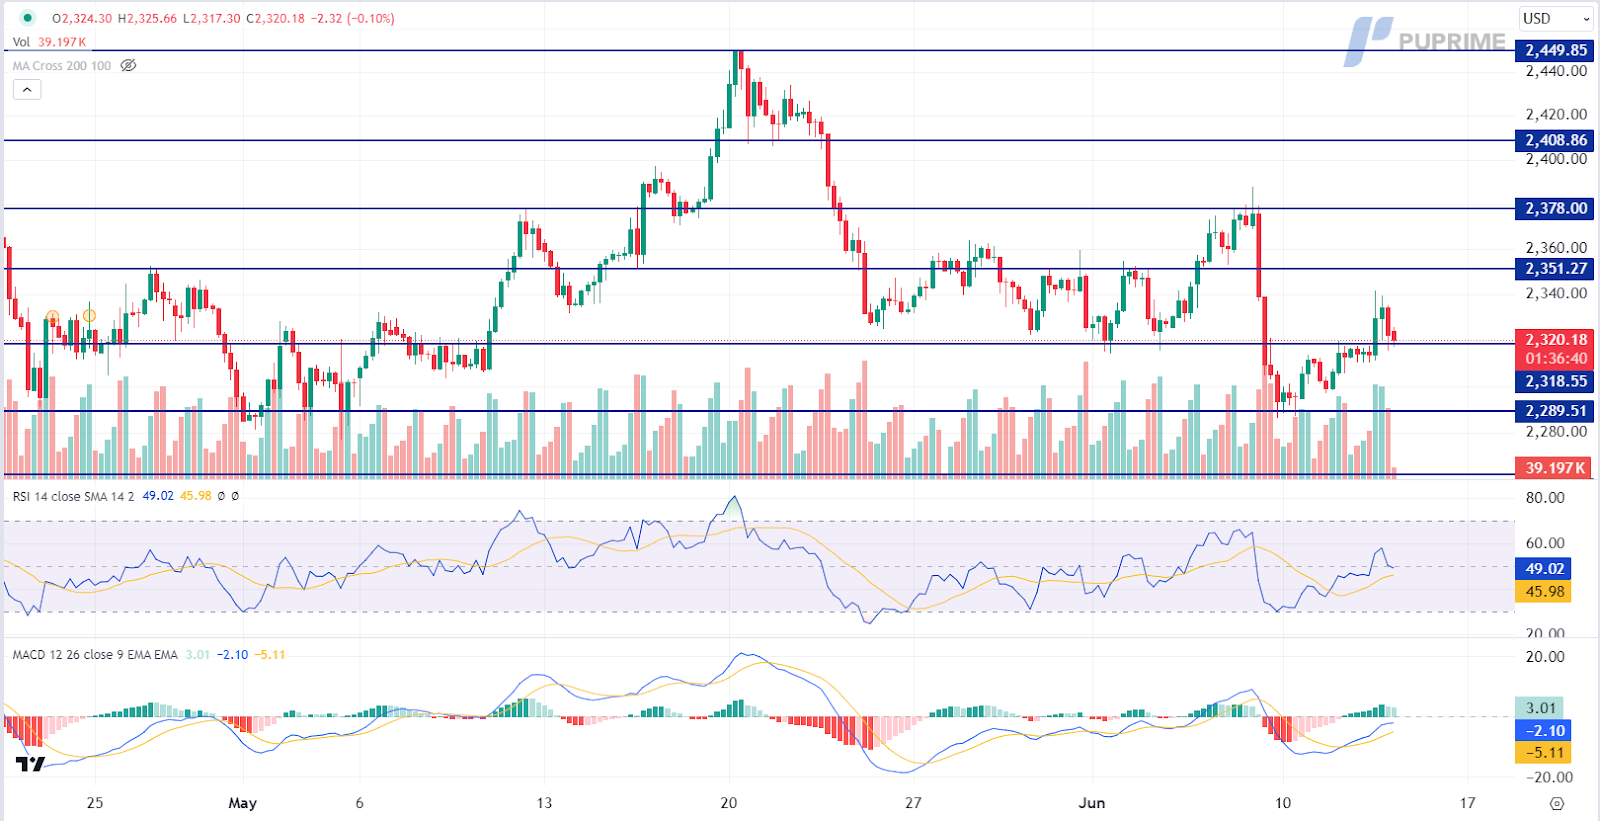
Gold prices rebounded sharply, initially buoyed by the depreciation of the US Dollar following the Federal Reserve’s dovish tones. US Treasury yields dipped further with rising expectations of rate cuts, adding to the bullish momentum for gold. However, investors subsequently took profits, leading to some retracement in gold prices. Despite the short-term bullish trend for gold, investors are advised to monitor strong resistance levels closely.
Gold prices are trading flat while currently near the support level. However, MACD has illustrated diminishing bullish momentum, while RSI is at 49, suggesting the commodity might extend its losses after breakout since the RSI stays below the midline.
Niveau de résistance : 2350,00, 2380,00
Support level: 2320.00, 2290.00
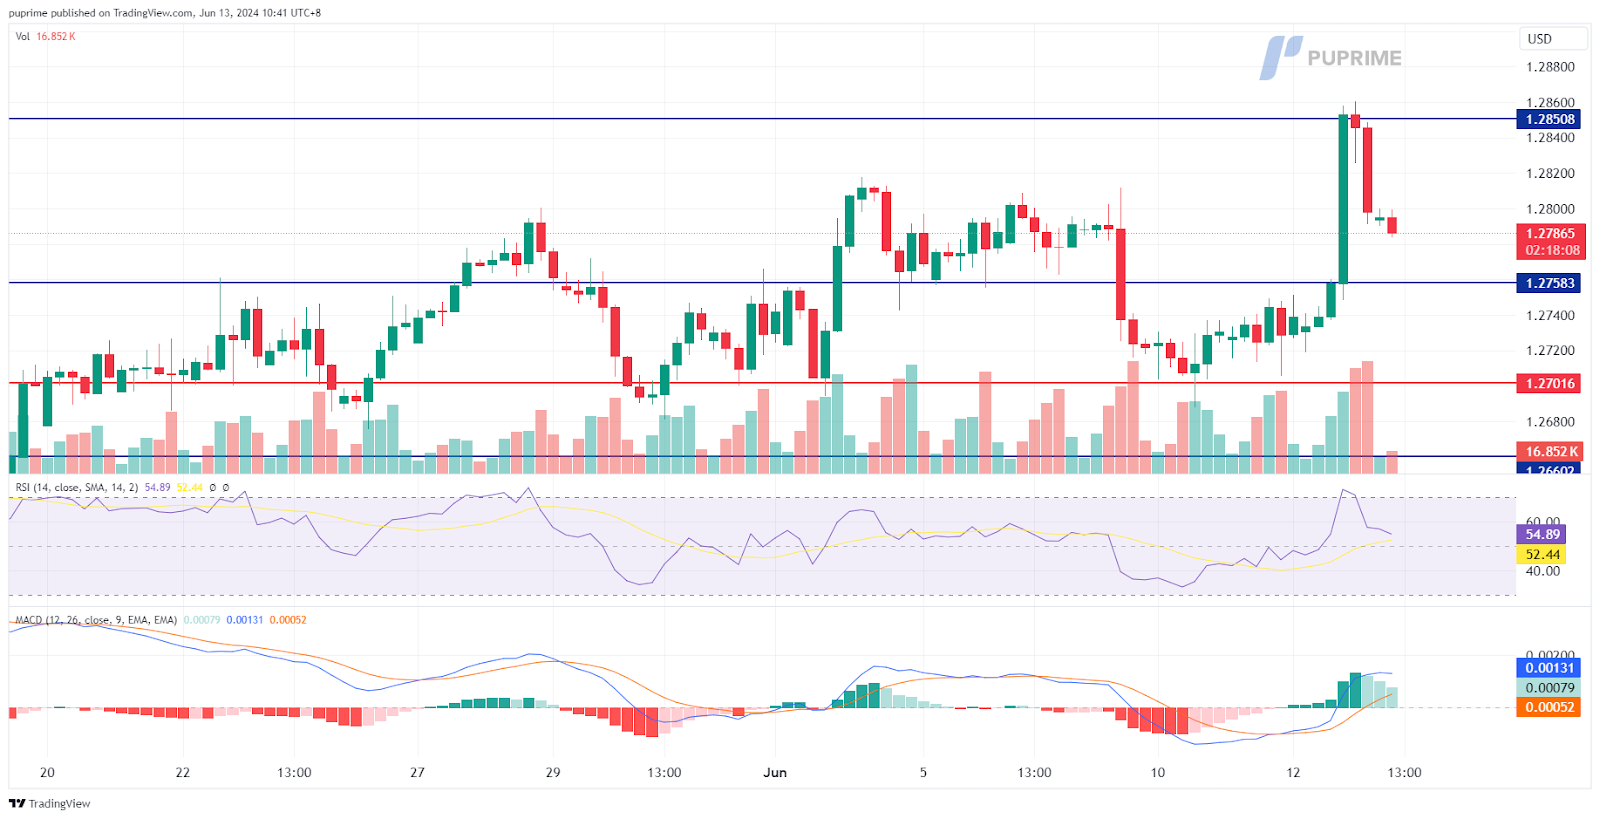
The GBP/USD pair surged sharply, reaching its highest level since March, but was subsequently rejected at the strong resistance level of 1.285. The initial surge was driven by a lower-than-expected U.S. CPI reading, which caused the dollar index to drop nearly 1%. However, the dollar later regained support following a hawkish statement from the Fed, which dampened the bullish momentum for the pair. This interplay of economic data and central bank signals highlights the volatile environment currently influencing the GBP/USD exchange rate.
The GBP/USD pair broke above its sideways trend and has formed a higher high, suggesting a bullish bias for the pair. The RSI has been gradually moving upward while the MACD has broken above the zero line and is diverging, suggesting the bullish momentum is gaining.
Niveau de résistance : 1,2850, 1,2940
Support level:1.2760, 1.2660
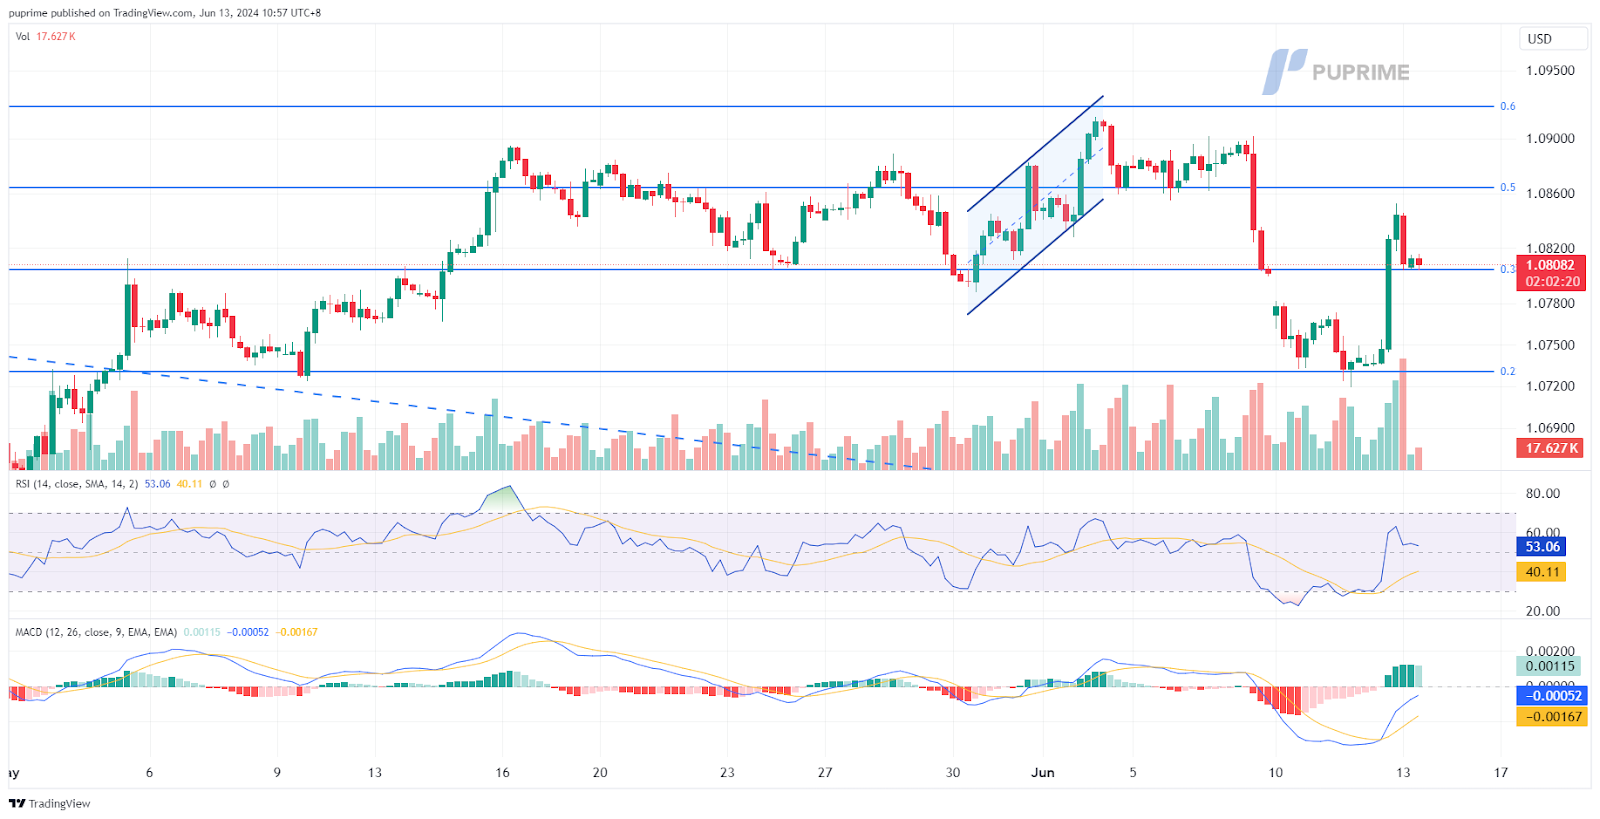
The EUR/USD pair recorded a significant rebound from its one-month low, recovering from political uncertainty that had weighed on the euro in recent sessions. The pair surged as the dollar weakened following the release of softer-than-expected U.S. CPI data, which shifted market sentiment. Today, traders will be closely watching the U.S. Initial Jobless Claims and eurozone’s Industrial Production data, both of which are expected to influence the pair’s direction.
EUR/USD rebounded and has surpassed its resistance level at 1.0800, suggesting a potential trend reversal for the pair. The RSI surged sharply, while the MACD crossed and is moving toward the zero line from below, suggesting the bearish momentum is vanishing.
Resistance level: 1.0864, 1.0924
Support level: 1.0800, 1.0730
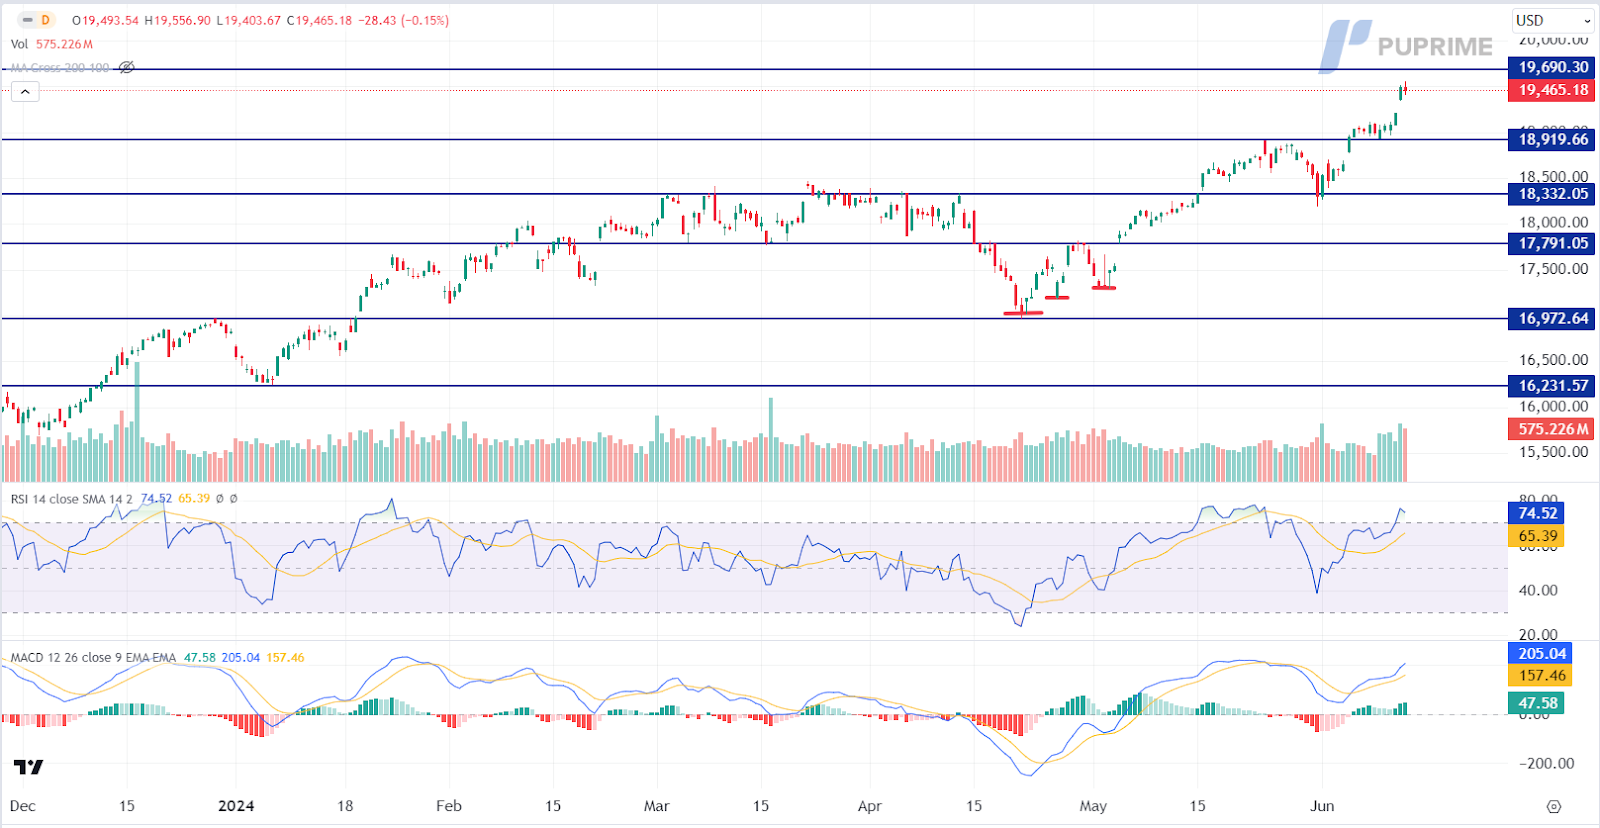
US equity markets continued to edge higher, buoyed by expectations of interest rate cuts in 2024, as indicated by Fed members. Recent data showing that inflation has cooled more than expected in May has stoked optimism that inflation in the US has stabilized, reducing the necessity for restrictive monetary policy. Meanwhile, the artificial intelligence hype remains strong in the market. The tech sector is in focus, with Oracle shares rising by 13% after the company announced new partnerships with ChatGPT-maker OpenAI and Google Cloud to extend its AI infrastructure.
Nasdaq is trading higher while currently near the resistance level. MACD has illustrated increasing bullish momentum.However, RSI is at 75, suggesting the index might enter overbought territory.
Niveau de résistance : 19690.00, 20000.00
Niveau de support : 18920.00, 18330.00
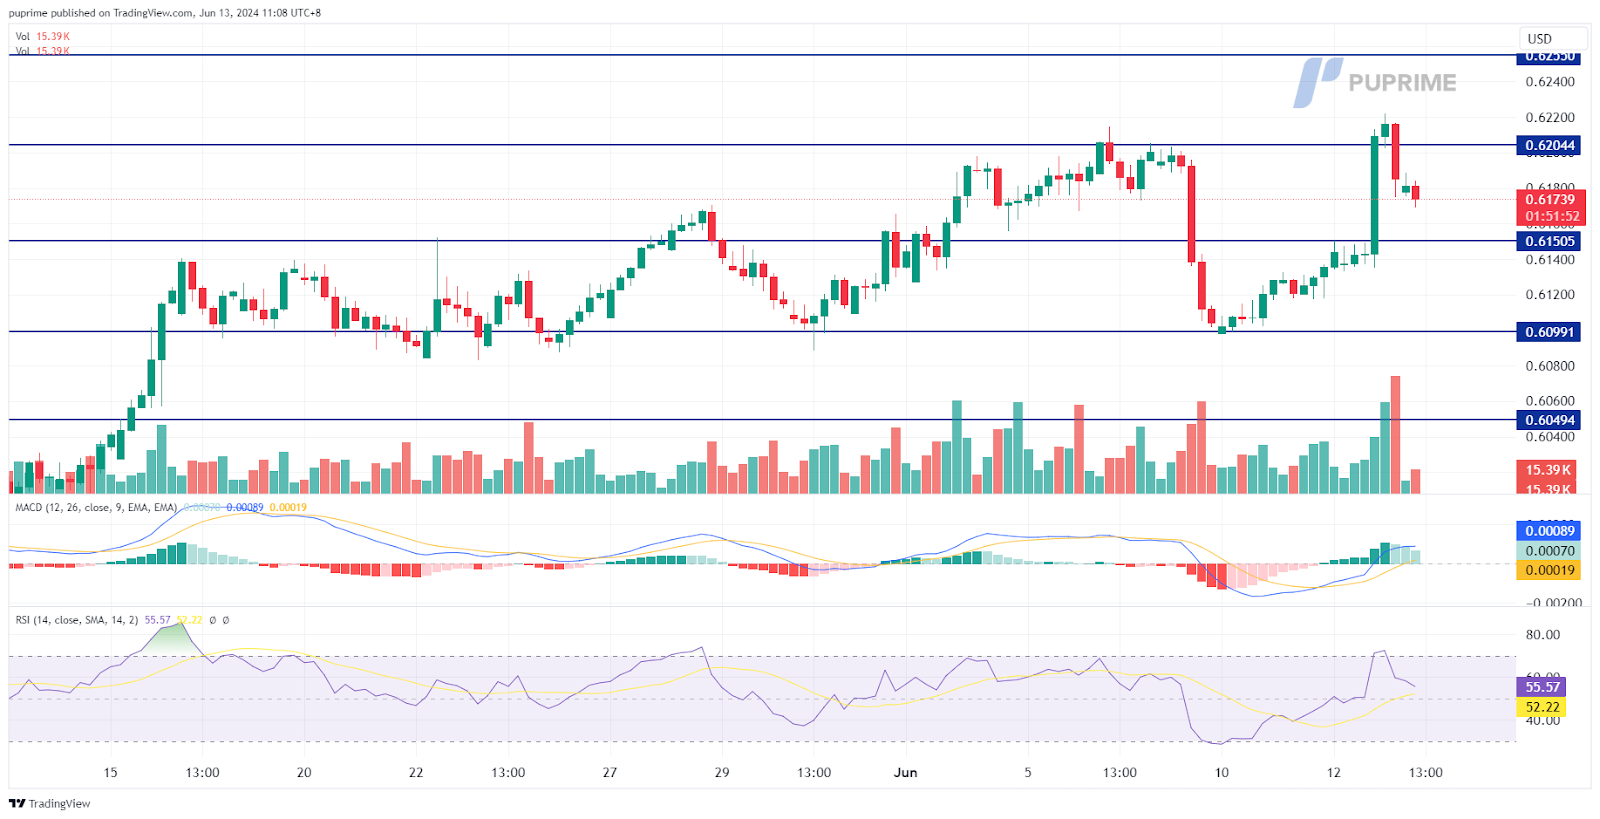
The NZD/USD pair experienced a significant jump in the last session, breaking through two resistance levels and indicating strong bullish momentum. The New Zealand dollar was bolstered by the Reserve Bank of New Zealand’s (RBNZ) hawkish stance, reflecting concerns over inflationary pressures in the country. However, the bullish momentum was tempered by the Federal Reserve’s hawkish stance, which provided some support to the U.S. dollar. As both central banks maintain a focus on combating inflation, the interplay between their respective policies will continue to influence the NZD/USD pair’s movement.
The NZD/USD pair has traded to its highest level in 2024, suggesting a bullish signal for the pair. The MADC has broken above the zero line and is diverging while the RSI has been surging, suggesting the bullish momentum is gaining.
Resistance level: 0.6200, 0.6255
Niveau de support : 0.6150, 0.6100
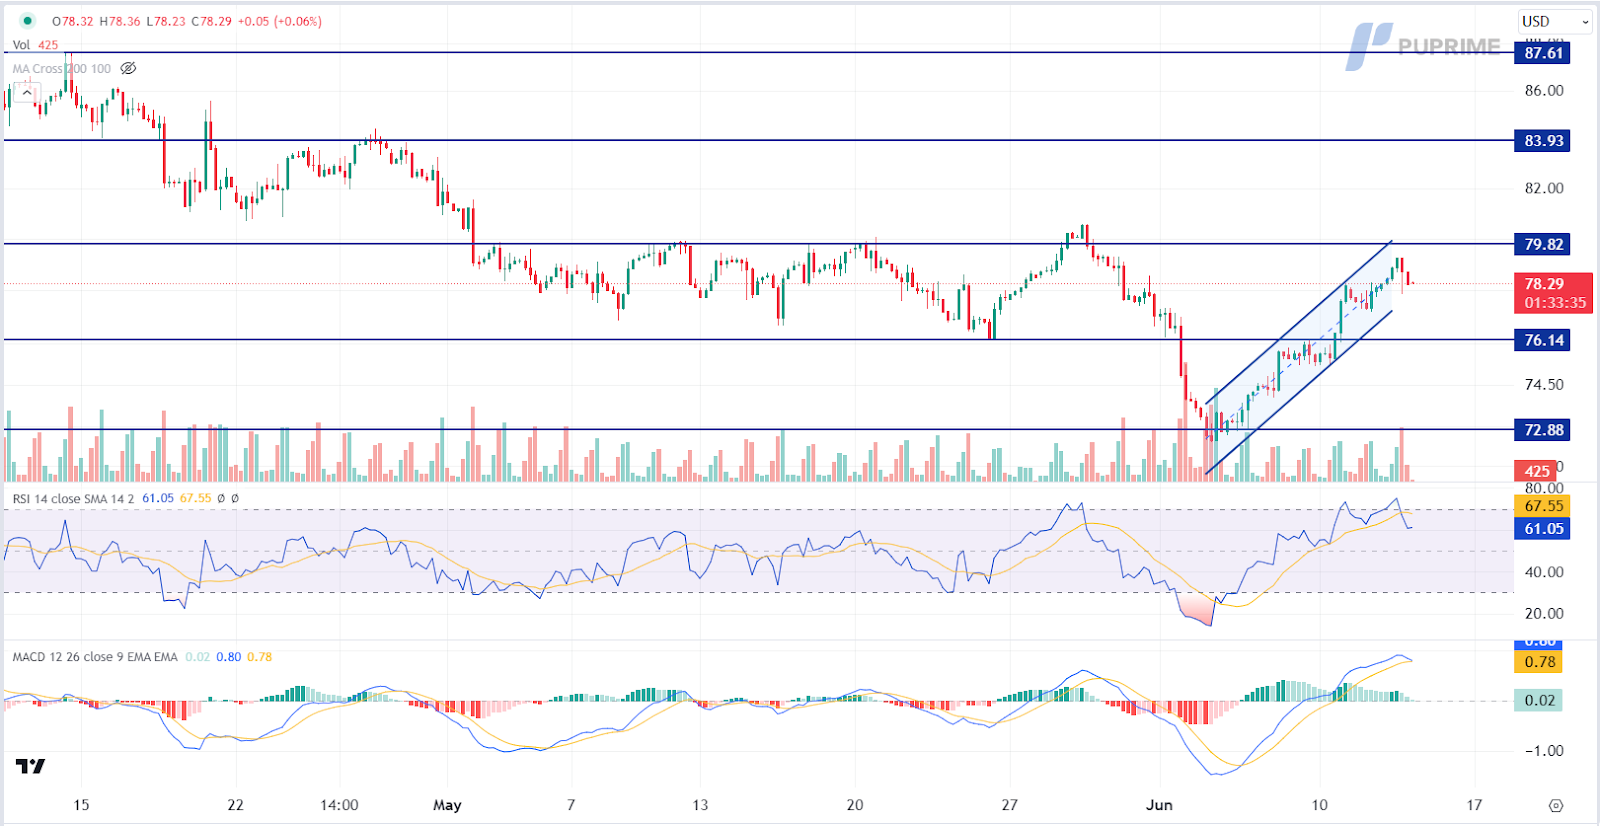
Crude oil prices remained bullish, supported by expectations that global central banks might shift toward cutting interest rates, which would likely boost economic growth and enhance oil demand indirectly. Positive demand forecasts from the International Energy Agency (IEA) and the Organization of the Petroleum Exporting Countries (OPEC) have also bolstered the oil market’s outlook. However, gains in the oil market were limited by a downbeat inventories report. According to the Energy Information Administration (EIA), US crude oil inventories increased by 3.730 million barrels, significantly higher than market expectations of a 1.200-million-barrel drawdown.
Les prix du pétrole se négocient à la hausse après avoir dépassé le niveau de résistance précédent. Cependant, le MACD a montré une diminution de la dynamique haussière, tandis que le RSI est à 68, ce qui suggère que le produit de base pourrait subir une correction technique puisque le RSI est entré dans le territoire de surachat.
Niveau de résistance : 79,80, 83,95
Niveau de support : 76.15, 72.90

Tradez le Forex, les indices, Métaux et plus encore avec des spreads faibles et une exécution ultra-rapide.
Inscrivez-vous pour un compte réel PU Prime grâce à notre procédure simplifiée.
Approvisionnez facilement votre compte grâce à un large éventail de canaux et de dispositifs acceptés.
Accédez à des centaines d'instruments avec les meilleures conditions de trading.
Plateformes de trading
Apprendre
À propos de PU Prime
Corporatif

Veuillez noter que le site web est destiné aux personnes résidant dans des juridictions où l'accès au site web est autorisé par la loi.
Veuillez noter que PU Prime et ses entités affiliées ne sont ni établies ni actives dans votre juridiction nationale.
En cliquant sur le bouton "Accuser réception", vous confirmez que vous accédez à ce site web uniquement de votre propre initiative et non à la suite d'une démarche commerciale spécifique. Vous souhaitez obtenir des informations à partir de ce site web, qui sont fournies sur la base d'une sollicitation inversée, conformément aux lois en vigueur dans votre pays.
Merci de votre reconnaissance !
Il convient de noter que le site web est destiné aux personnes résidant dans des juridictions où l'accès au site web est autorisé par la loi.
Tenez compte du fait que PU Prime et ses entités affiliées ne sont pas établies et n'opèrent pas dans votre juridiction d'origine.
En cliquant sur le bouton "Accepter", vous confirmez que vous entrez sur ce site web de votre propre initiative et non à la suite d'un quelconque effort de marketing spécifique. Vous souhaitez obtenir des informations sur ce site web qui sont fournies par le biais d'une demande inversée conformément aux lois de votre juridiction d'origine.
Merci de votre reconnaissance !
