


-
- Plateformes de trading
- Application PU Prime
- MetaTrader 5
- MetaTrader 4
- PU Copy Trading
- Trader Web
- PU Social
-
- Conditions de Trading
- Types de compte
- Spreads, Coûts et Swaps
- Dépôts et Retraits
- Frais et Charges
- Heures de Trading

20 February 2024,02:09
Daily Market Analysis
20 February 2024, 02:09


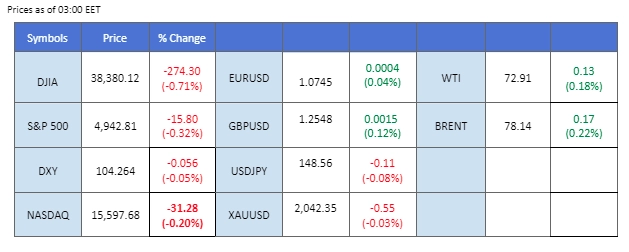
The dollar maintained its strength and continued to rise, propelled by robust economic data released yesterday. Higher-than-expected ISM PMI figures indicated ongoing strength in the U.S. economy despite elevated borrowing costs. The U.S. equity markets faced headwinds due to shifts in the Federal Reserve’s monetary policy outlook, leading to speculation of a prolonged period of monetary tightening. Meanwhile, in Japan, lower-than-expected Household Spending figures presented a challenge for the authorities considering a shift in the current monetary policy. The economic performance didn’t provide convincing evidence for the central bank to make a move. Additionally, Australian December Retail Sales significantly missed expectations, leading to strong beliefs that the Reserve Bank of Australia (RBA) may maintain its current interest rate when the decision is announced later today.
Current rate hike bets on 20th March Fed interest rate decision:
Source: CME Fedwatch Tool
0 bps (65%) VS -25 bps (35%)
(MT4 System Time)
N/A
Source: MQL5
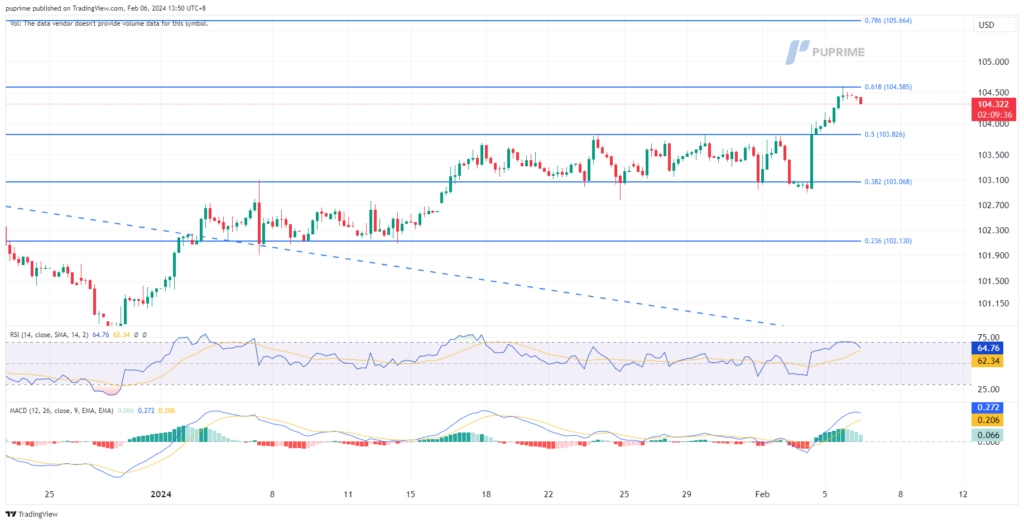
The Dollar Index extends its gains, hitting an 11-week high as traders reduce bets on aggressive Federal Reserve interest rate cuts. Better-than-expected economic data, including US ISM Non-Manufacturing PMI and Non-Manufacturing Prices, bolster confidence in the US economy, reflected in surging US Treasury yields. Fed funds futures now indicate approximately 115 basis points of easing priced in for the year, down from 150 bps at the end of the previous year. The likelihood of a March rate cut has dropped significantly, signalling a notable shift in market sentiment, according to CME Group FedWatch Tool.
The Dollar Index is trading higher while currently testing the resistance level. However, MACD has illustrated diminishing bullish momentum, while RSI is at 69, suggesting the index might enter overbought territory.
Resistance level: 104.60, 105.65
Support level: 103.85, 103.05
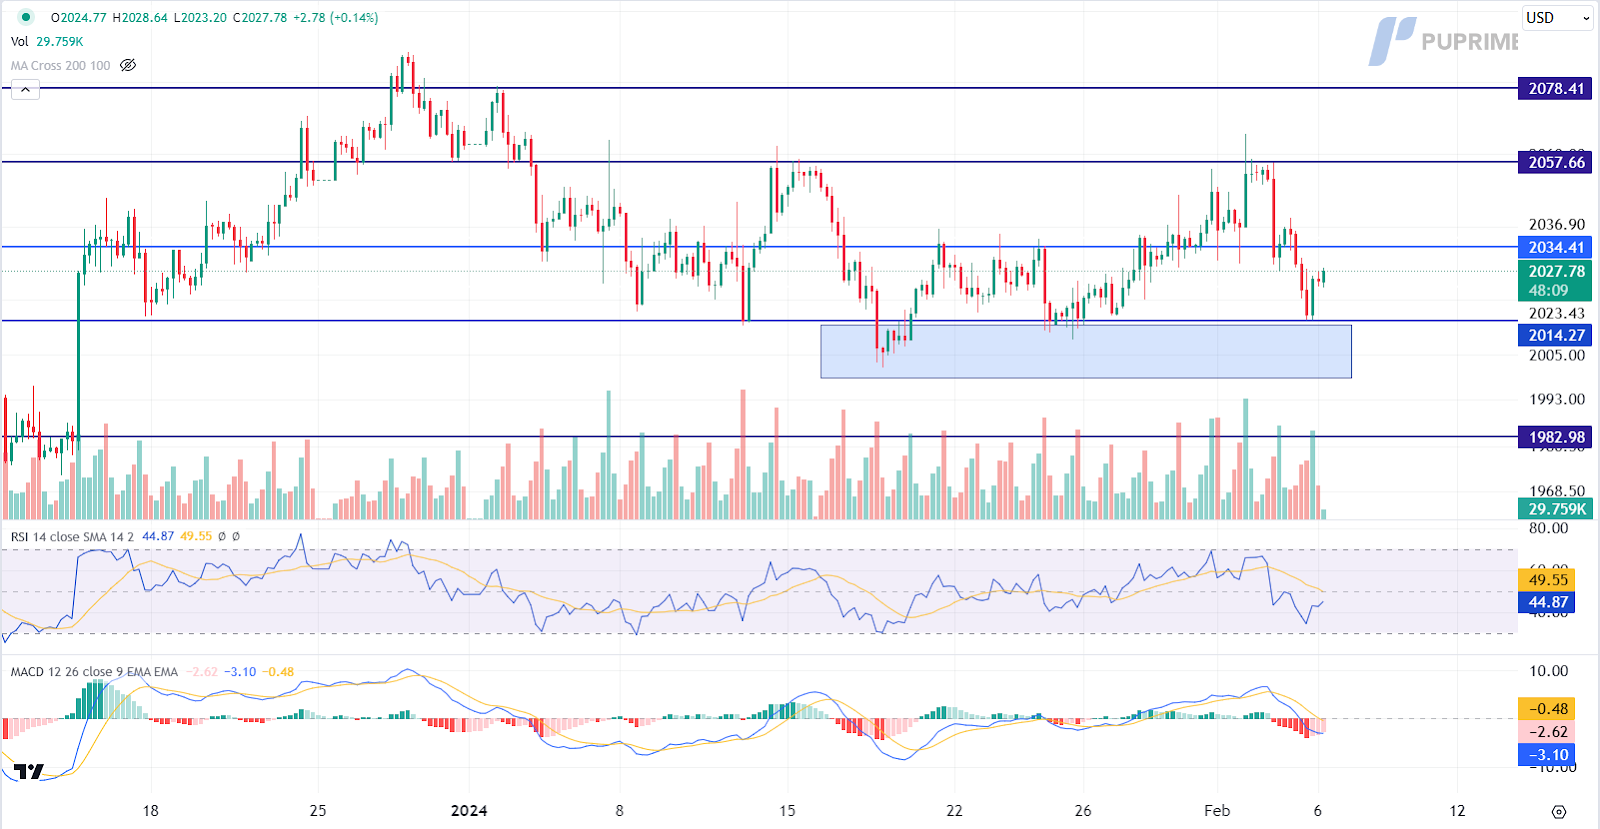
Gold prices initially experience a notable slump amid the ascent of the US Dollar and a string of better-than-expected economic indicators, eroding the allure of the safe-haven asset. However, following a crucial support level breach, investors pivot towards bargain buying, citing uncertainties in Middle East tensions as a catalyst for this strategic move.
Gold prices are trading higher following the prior rebound from the support level. MACD has illustrated diminishing bearish momentum, while RSI is at 45, suggesting the commodity might extend its gains since the RSI rebounded sharply from oversold territory.
Resistance level: 2035.00, 2055.00
Support level: 2015.00, 1985.00
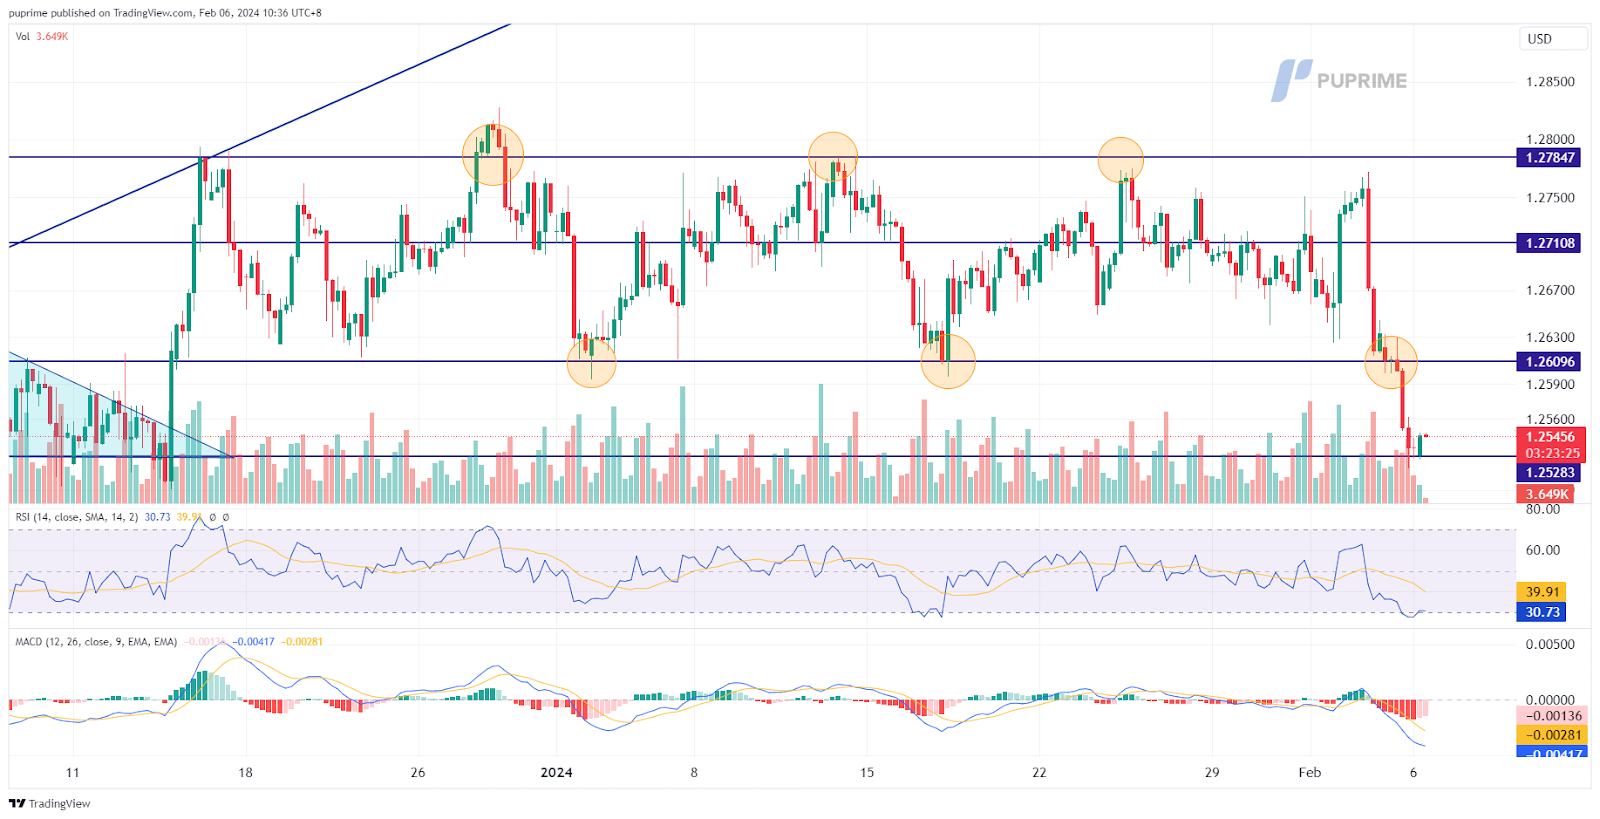
The GBP/USD witnessed a significant decline, breaking below its sideways range that had been formed since last December. The U.S. dollar continued strengthening, fueled by robust economic performance, indicating that the Federal Reserve’s monetary tightening policy would persist. The U.S. treasury yield remained firm at above 4.1%, offering strong support for the dollar as well.
GBPUSD has broken below its wide sideway trend, suggesting a bearish bias for the pair. The RSI has declined to near the oversold zone while the MACD moving lower and diverging suggests the bearish momentum is strong.
Resistance level: 1.2610, 1.2710
Support level:1.2440, 1.2320
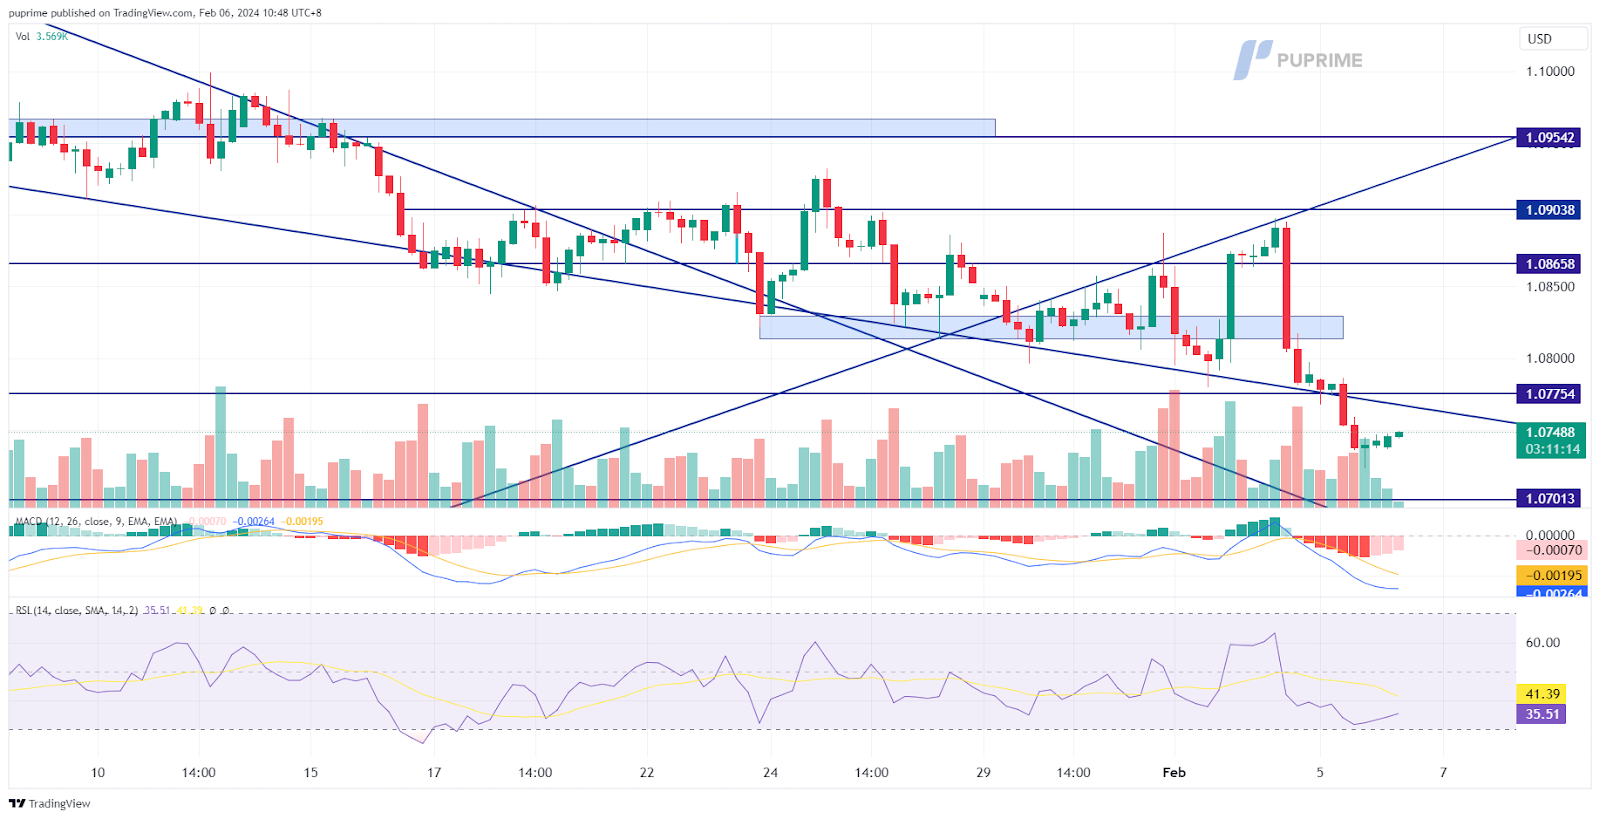
The EUR/USD pair has broken below its bearish expanding triangle pattern, failing to defend its support level at 1.0775, indicating a bearish signal for the pair. Traders are anticipating the German factory orders data and German Industrial production to gauge the strength of the euro, while the dollar’s strength continues to remain robust.
The EUR/USD traded to its lowest level since last December and has a lower low price pattern, suggesting a bearish bias for the pair. The RSI is approaching the oversold zone while the MACD continues to slide and diverge, suggesting the bearish momentum is strong.
Resistance level: 1.0775, 1.0866
Support level: 1.0700, 1.0630
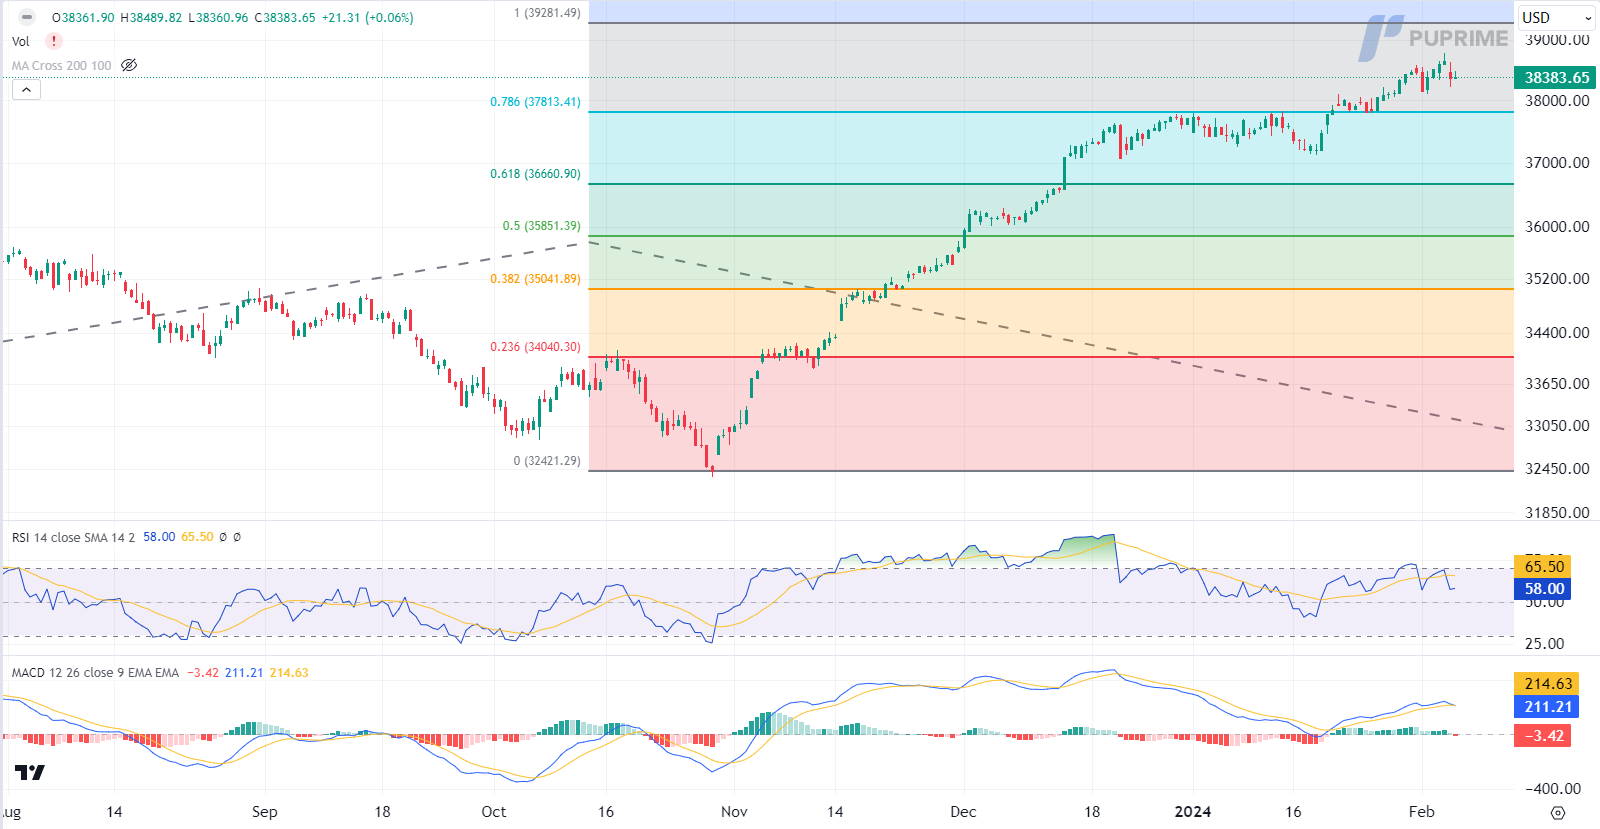
US equity markets experience slight retreats, attributed to technical correction and profit-taking by global investors. Rising US Treasury yields add pressure, although strong performances by major corporations provide some support. Investors pivot towards earnings reports, company guidance, and Fed statements for further market cues.
Dow Jones extended its gains after it successfully breakout above the resistance level. However, MACD has illustrated increasing bearish momentum, while RSI is at 58, suggesting the index might experience technical correction since the RSI retreated sharply from overbought territory.
Resistance level: 39280.00, 40000.00
Support level: 37815.00, 36600.00
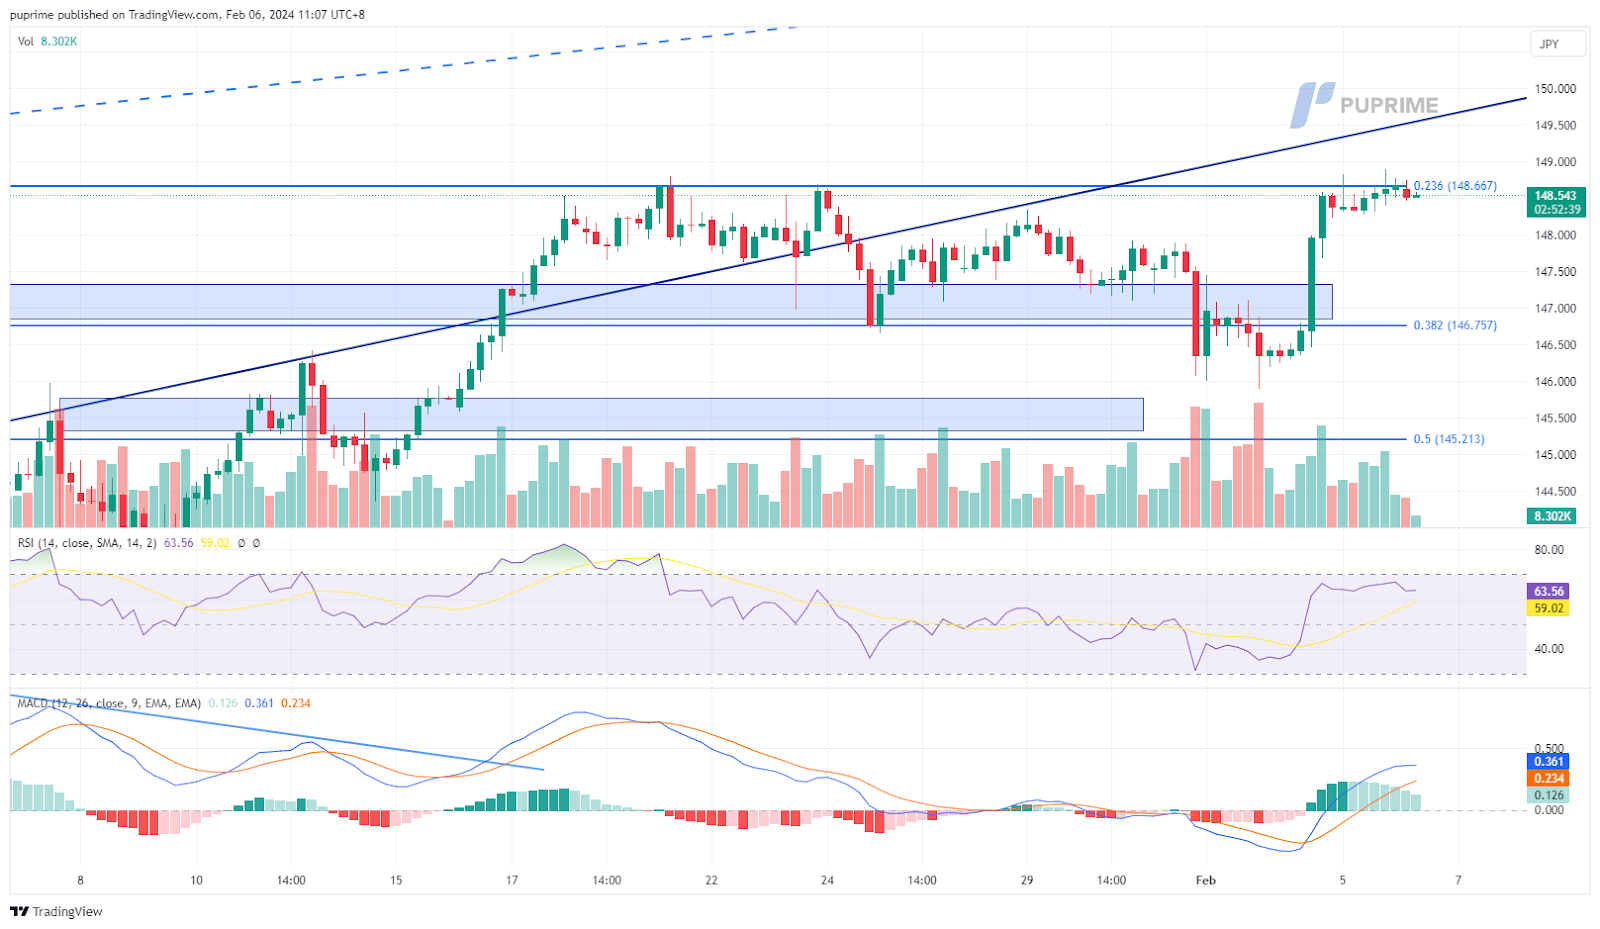
The USD/JPY pair continues its climb but is currently encountering strong resistance near the 148.67 level. The recently released Japan Household Spending data came in lower than expected, suggesting a slight economic contraction. This has put the Bank of Japan (BoJ) in a dilemma, as the central bank initially planned to make a shift in its monetary policy in the first quarter of 2024. The lacklustre economic performance has put a pause on such a move.
The pair is currently holding at the resistance level of 148.67; a break above such a level suggests a solid bullish signal for the pair. The RSI remains at the elevated level while the MACD continues to climb and is diverging, suggesting a strong bullish momentum.
Resistance level: 148.67, 151.75
Support level: 146.75, 145.21
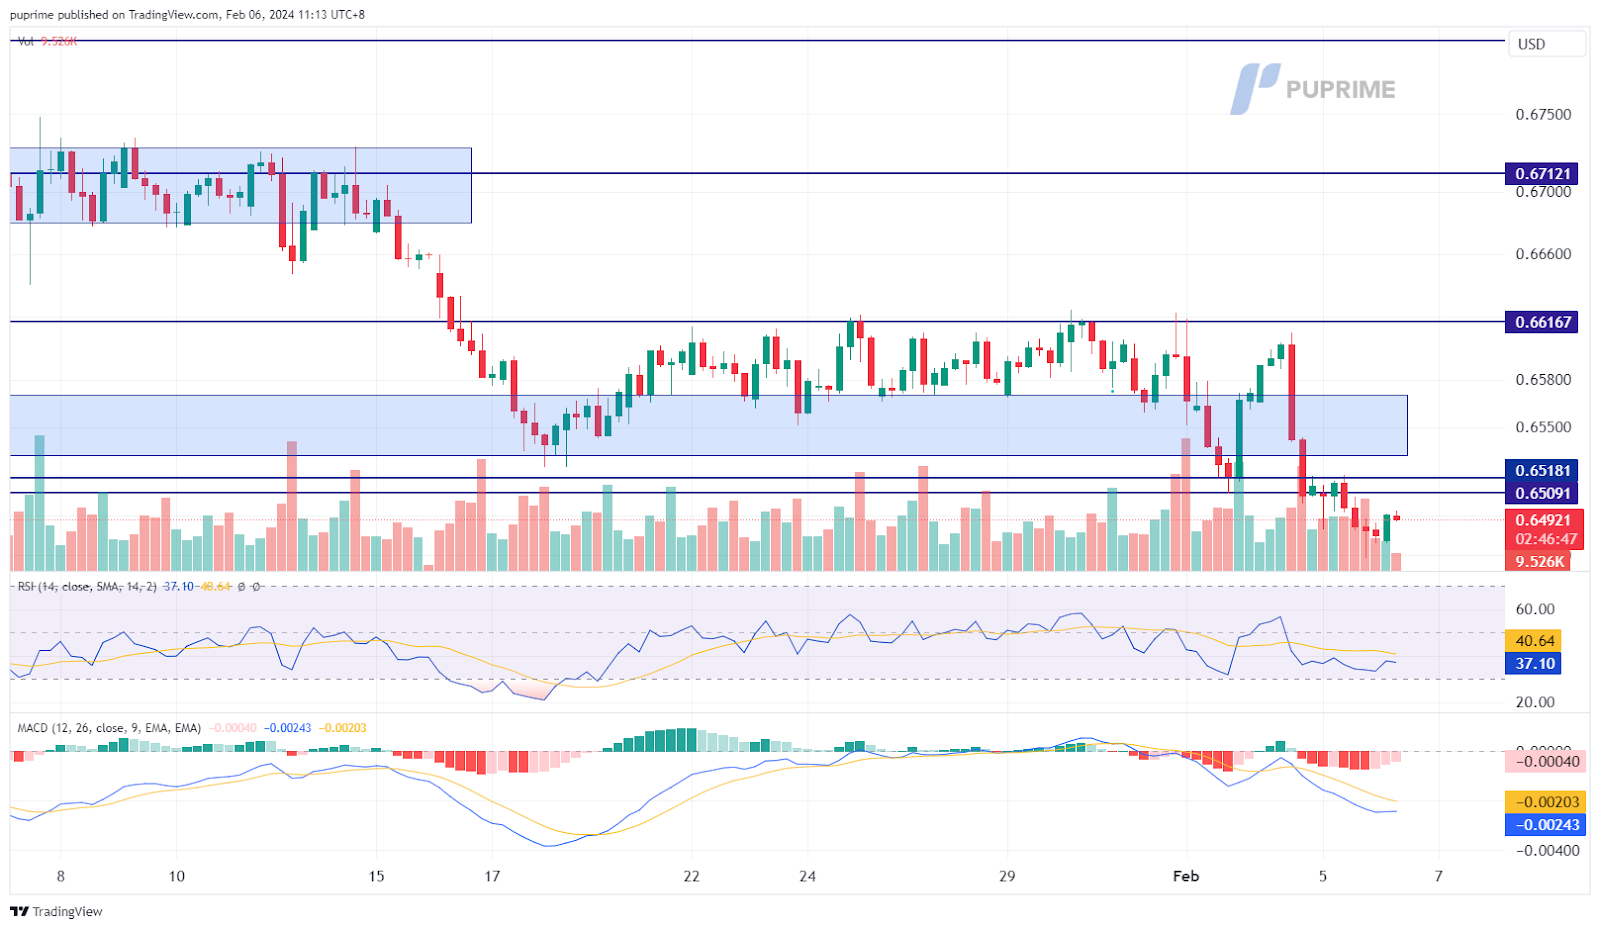
The AUD/USD pair continues to slide as the U.S. dollar gains strength on robust economic data. Meanwhile, the just-released Australian Retail Sales reading came in significantly lower at -2.7% from the previous reading of 1.6%, suggesting that the Reserve Bank of Australia (RBA) may be inclined to maintain its current interest rate level. As a result, the Australian dollar is under strong pressure and may continue to slide.
The pair is currently trading at its lowest level since last November and has formed a lower-low price pattern, suggesting a bearish bias for the pair. The RSI has been flowing near the oversold zone while the MACD continues to slide, suggesting a strong bearish momentum.
Resistance level: 0.6510, 0.6617
Support level: 0.6390, 0.6300
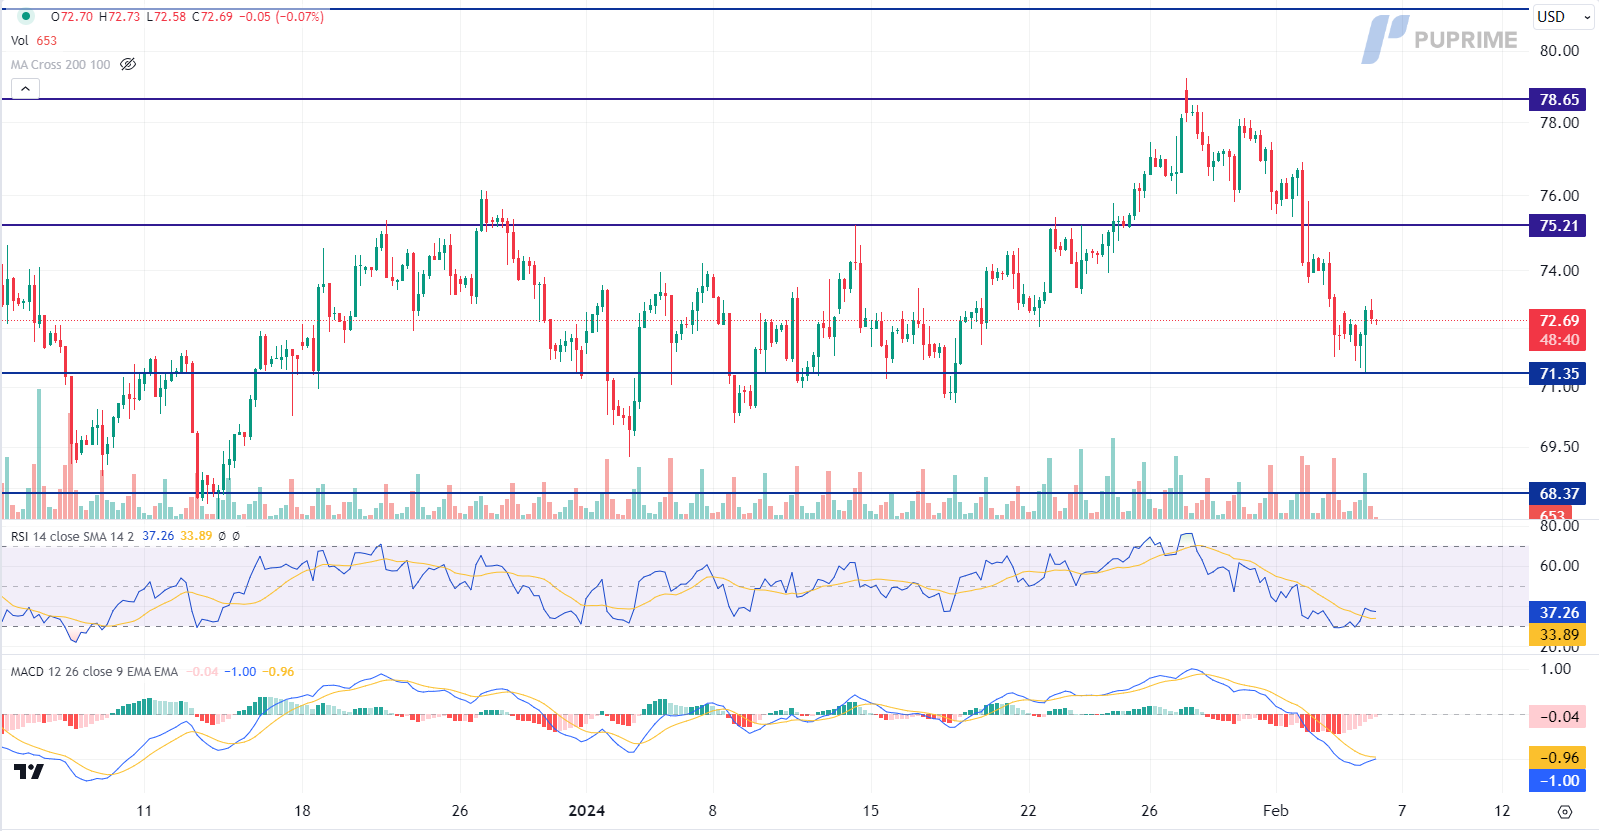
Oil prices extend losses as hopes for resolving the Israel-Hamas conflict diminish fears of oil supply disruptions. Signs of progress towards a ceasefire agreement between Israel and Hamas contribute to the downward pressure on oil prices, reflecting ongoing negotiations facilitated by Qatar. However, uncertainties persist as parties await further developments in the delicate negotiations.
Oil prices are trading lower while currently testing the support level. However, MACD has illustrated diminishing bearish momentum, while RSI is at 37, suggesting the commodity might experience technical correction since the RSI rebounded sharply from oversold territory.
Resistance level: 75.20, 78.65
Support level: 72.05, 68.35

Tradez le Forex, les indices, Métaux et plus encore avec des spreads faibles et une exécution ultra-rapide.
Inscrivez-vous pour un compte réel PU Prime grâce à notre procédure simplifiée.
Approvisionnez facilement votre compte grâce à un large éventail de canaux et de devises acceptées.
Accédez à des centaines d’instruments avec les meilleures conditions de trading.
Plateformes de trading
Apprendre
À propos de PU Prime
Corporatif

Please note the Website is intended for individuals residing in jurisdictions where accessing the Website is permitted by law.
Please note that PU Prime and its affiliated entities are neither established nor operating in your home jurisdiction.
By clicking the "Acknowledge" button, you confirm that you are entering this website solely based on your initiative and not as a result of any specific marketing outreach. You wish to obtain information from this website which is provided on reverse solicitation in accordance with the laws of your home jurisdiction.
Thank You for Your Acknowledgement!
Ten en cuenta que el sitio web está destinado a personas que residen en jurisdicciones donde el acceso al sitio web está permitido por la ley.
Ten en cuenta que PU Prime y sus entidades afiliadas no están establecidas ni operan en tu jurisdicción de origen.
Al hacer clic en el botón "Aceptar", confirmas que estás ingresando a este sitio web por tu propia iniciativa y no como resultado de ningún esfuerzo de marketing específico. Deseas obtener información de este sitio web que se proporciona mediante solicitud inversa de acuerdo con las leyes de tu jurisdicción de origen.
Thank You for Your Acknowledgement!
