PU Prime App
Exclusive deals on mobile


PU Prime App
Exclusive deals on mobile
Tenir les marchés mondiaux entre vos mains
Notre application de trading pour mobile est compatible avec la plupart des appareils intelligents. Téléchargez l’application dès maintenant et commencez à trader avec PU Prime sur tout appareil, à tout moment et en tout lieu.


10 May 2023,05:41
Daily Market Analysis
10 May 2023, 05:41


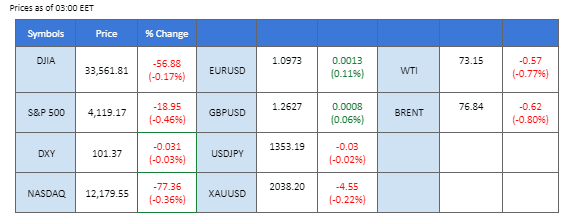
As investors await the U.S. Consumer Price Index (CPI) and monitor the development of the U.S. debt ceiling, the markets remain subdued. Most of the asset classes saw little change overnight ahead of the U.S. CPI, which is due to release later today (10th May). On the other hand, the market is looming with the U.S. debt default even as the President is in talks with the House Speaker. However, with both parties divided on the matter, progress remains elusive. Additionally, oil prices have surged by over 5% across the past three sessions, fueled by supply disruptions in Canada caused by wildfires that have impacted the supply by 500,000 barrels per day. Further contributing to upward momentum, the U.S. has announced an updated plan to refill its strategic petroleum reserve.
Current rate hike bets on 14th June Fed interest rate decision:
Source: CME Fedwatch Tool
0 bps (78.8%) VS 25 bps (21.2%)

The US Dollar managed to edge higher against major currencies, buoyed by the rising short-term US Treasury yields. Heightened uncertainty surrounding the debt ceiling impasse prompted investors to aggressively sell off short-term bonds, resulting in a substantial surge in the yield on 1-month Treasury bills. The yield skyrocketed by 23.8 basis points, peaking at 5.689%.
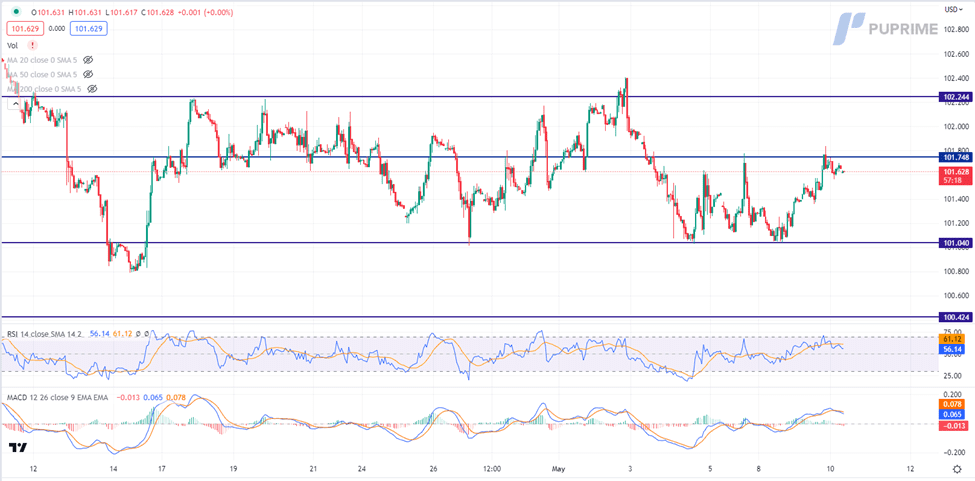
The Dollar Index is trading higher while currently testing the resistance level. However, MACD has illustrated increasing bearish momentum, while RSI is at 56, suggesting the index might trade lower as technical correction since the RSI retreated sharply from overbought territory.
Resistance level: 101.75, 102.25
Support level: 101.05, 100.40
Amid mounting concerns surrounding the impending release of crucial data on US Consumer Prices, safe-haven gold extends its bullish momentum. Investors are growing increasingly anxious about the possibility of a government default as early as June 1st if Congress fails to reach a timely resolution. In this environment of uncertainty, gold, a traditional safe-haven asset, has emerged as a preferred choice for investors seeking to hedge to protect their portfolios from potential market volatility.
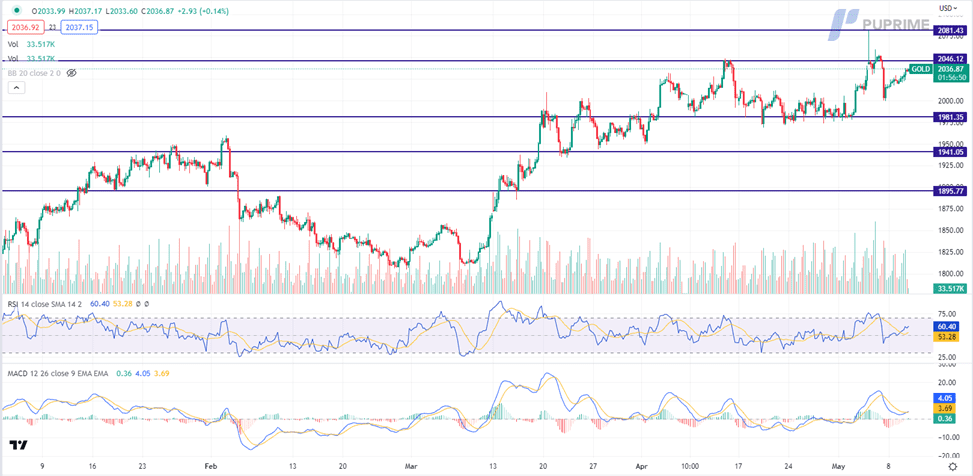
Gold prices are trading higher while currently near the resistance level. MACD has illustrated diminishing bearish momentum. RSI is at 60, suggesting the commodity might extend its gains after successfully breakout since the RSI stays above the midline.
Resistance level: 2045.00, 2080.00
Support level: 1980.00, 1940.00
The euro continues to trade poorly against the U.S. Dollar, trading below 1.1000. ECB members continue to release hawkish statements speaking about further rate hikes; however, it does not stimulate the euro to trade higher. On the other hand, the U.S. CPI data is much anticipated and is due to be released today (10th May). The question for investors is if the CPI remains high, is the Fed still able to continue raising interest rates given that the banking turmoil is not resolved and the country is facing a debt default crisis?
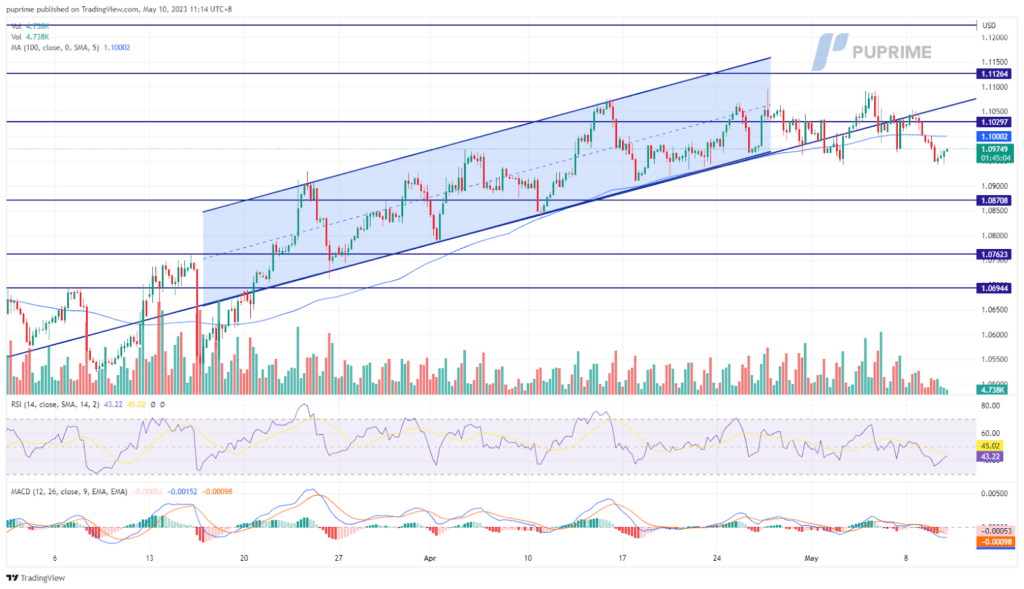
The euro is trading stagnantly below 1.1000 and has fallen out of the uptrend channel. The RSI is moving toward the oversold zone while the MACD has broken below the zero line suggesting that the bearish momentum for the euro is building.
Resistance level: 1.1126, 1.1225
Support level: 1.0871, 1.0762
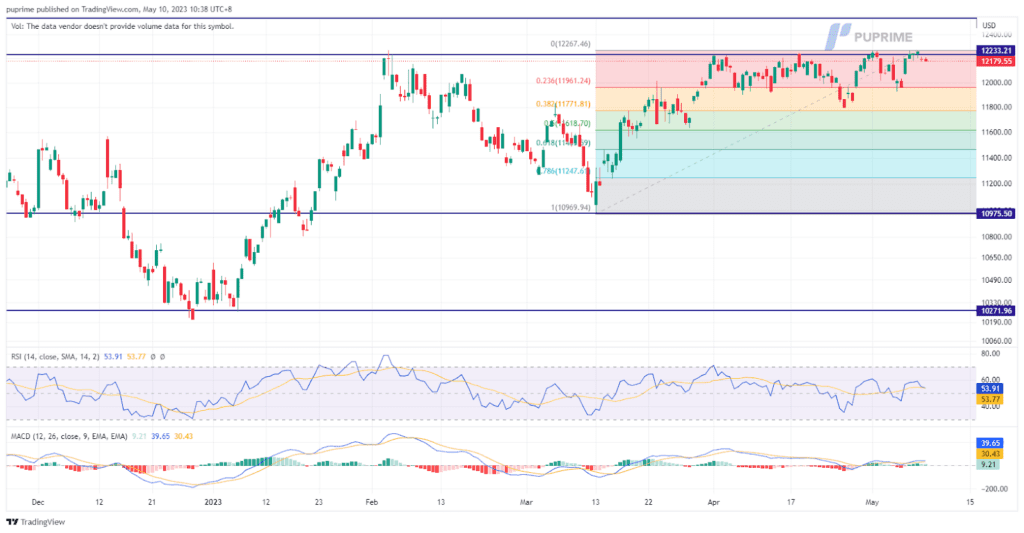
On Tuesday, the Nasdaq Composite declined by 0.63% to 12,179.55 due to concerns about U.S. inflation data and the ongoing negotiations regarding the U.S. debt ceiling. Traders were waiting for an update on plans for the debt ceiling from a meeting between President Joe Biden, Republican House Speaker Kevin McCarthy, and other congressional leaders at the White House. Anxiety persists as a potential government default looms over Washington as early as June 1 if Congress fails to resolve the deadlock. PayPal Holdings (PYPL.O) was among the top drags on the Nasdaq after the company cut its margin forecast.
The Nasdaq is still trading near its previous high of 12,264 points, and technical indicators such as RSI and MACD indicate bullish sentiment. Investors are advised to monitor the market for a potential breakout above this level.
Resistance level: 12264, 12536
Support level: 11961, 11771
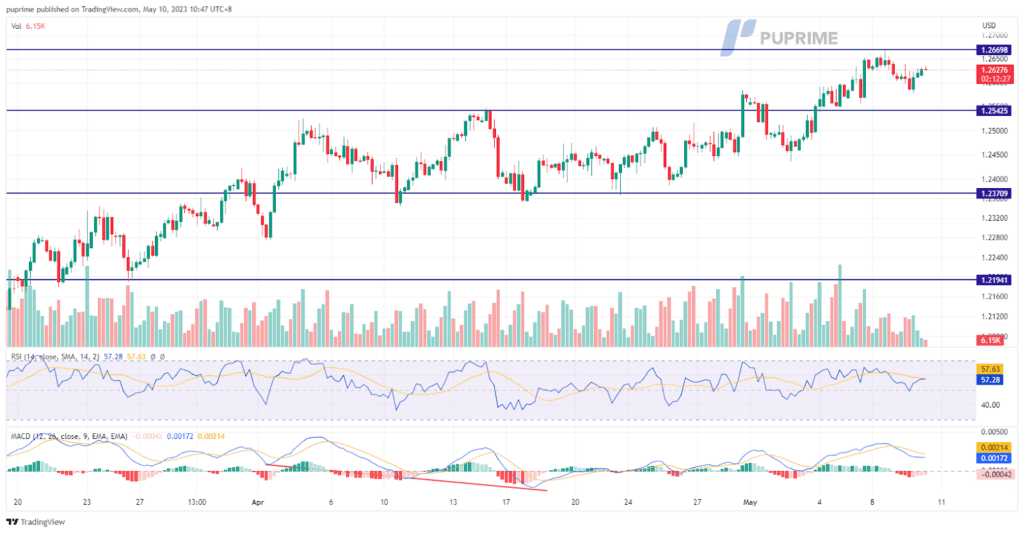
The pound eased slightly to $1.2628 against the U.S. dollar on Tuesday but remained near its one-year high, ahead of the Bank of England’s policy decision later in the week. The pound’s strong performance is due to stronger-than-expected economic data in the U.K., which has avoided a deep recession, and a weaker U.S. dollar dragged down by slower U.S. inflation and growing expectations that the Federal Reserve is nearing the end of its rate hiking cycle. The BoE has raised interest rates 11 times since December 2021 to combat double-digit inflation. Sterling is expected to rally if market-implied inflation forecasts do not show inflation falling below the 2% target over the medium term.
The pound’s overall trend remains strong, with RSI and MACD indicators signalling bullish momentum.
Resistance level: 1.2774, 1.2973
Support level: 1.2542, 1.2371
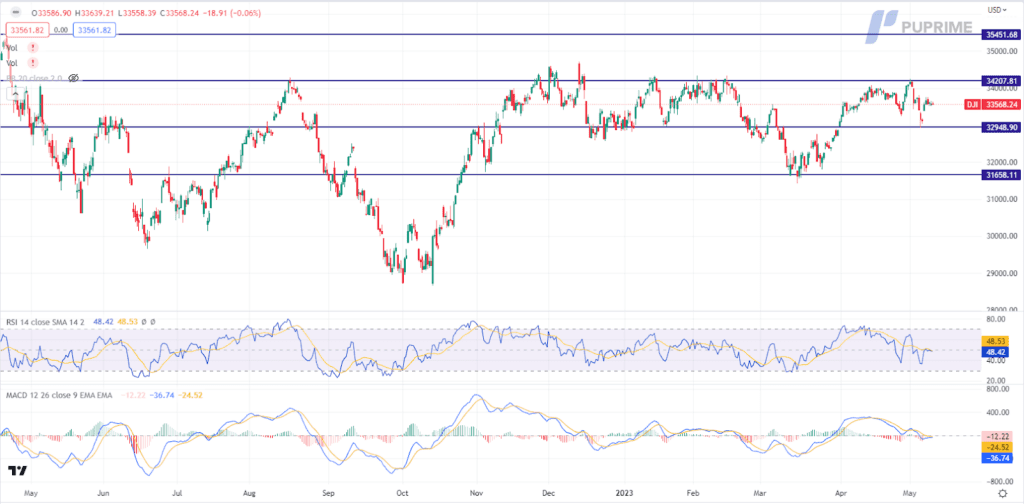
The Dow experienced a notable decline on Tuesday as mounting concerns ahead of the release of key data on US Consumer Prices cast a shadow over investor sentiment. Simultaneously, the impasse surrounding the US debt ceiling issue triggered a sharp sell-off in short-term Treasury yields, exacerbating market apprehension. Investors are increasingly fearful of a potential government default as early as June 1st if Congress fails to reach a resolution.
The Dow is trading flat following the prior rebound from the support level. MACD has illustrated diminishing bearish momentum, while RSI is at 48, suggesting the index might continue to trade within a range as the RSI stays near the midline.
Resistance level: 34205.00, 35450.00
Support level: 32950.00, 31660.00
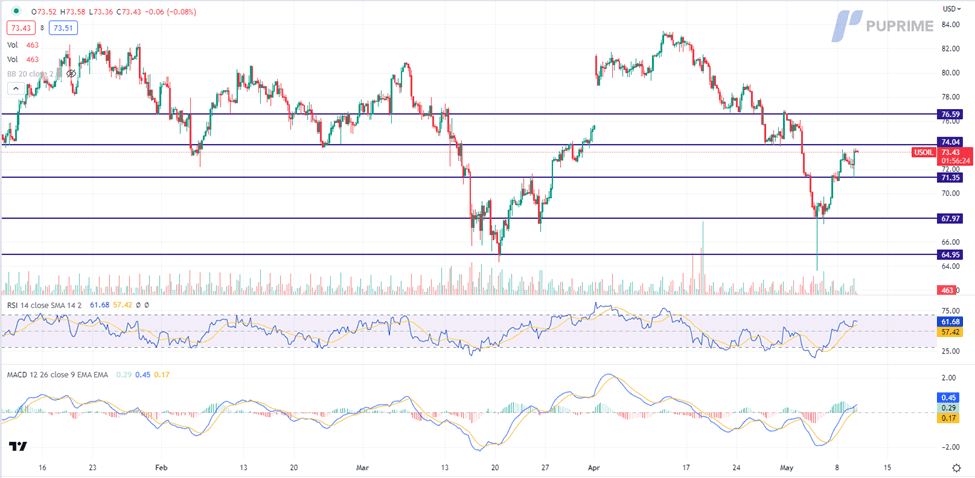
Crude oil prices experienced a notable surge following the release of a report by the Energy Information Administration (EIA), signalling higher seasonal demand and lower-than-anticipated output. The EIA’s Short-term Energy Outlook emphasised the expected increase in oil consumption during the seasonal upswing, coupled with a decline in OPEC crude oil production. These factors are projected to exert upward pressure on crude oil prices in the coming months, bolstering market sentiment.
Oil prices are trading higher while currently testing the resistance level. MACD has illustrated increasing bullish momentum, while RSI is at 62, suggesting the commodity might extend its gains after successfully breakout since the RSI stays above the midline.
Resistance level: 74.05, 76.60
Support level: 71.35, 67.95

Tradez le Forex, les indices, Métaux et plus encore avec des spreads faibles et une exécution ultra-rapide.
Inscrivez-vous pour un compte réel PU Prime grâce à notre procédure simplifiée.
Approvisionnez facilement votre compte grâce à un large éventail de canaux et de devises acceptées.
Accédez à des centaines d’instruments avec les meilleures conditions de trading.
Plaquettes de trading
Entreprise
FAQs
Application PU Prime - Commencez à trader avec un avantage


Risk Warning: Trading Contract for Difference (CFD) carries a high level of risk to your capital and may result in losses that exceed your deposits due to leverage. It's important to understand how CFDs work and assess whether you can afford the high risk of losing your money. When acquiring our derivative products, you do not own or have rights in the underlying assets. Past performance is not indicative of future results. The information on this website is general and does not take into account your personal objectives, financial circumstances, or needs. Seek independent advice from qualified experts if necessary, and ensure you fully understand the risks before making any trading decisions.
PU Prime is a brand name of different entities authorised and registered in various jurisdictions.
PU Prime Limited is authorized and regulated by the Financial Services Authority of Seychelles under License No. SD050, with registered address at CT House, Office 1A, Providence, Mahe, Seychelles.
PU Prime Ltd is authorized and regulated by the Financial Services Commission of Mauritius under License No. GB23202672, with registered address at Suite 201 Level 2, The Catalyst Building, 40 Silicon Avenue, Cybercity Ebene, Mauritius.
PU Prime (Pty) Ltd is an authorised Financial Services Provider registered and regulated by the Financial Sector Conduct Authority of South Africa under License No. 52218, with registered address at 37 Harley Street, Ferndale, Randburg, Gauteng, South Africa.
The information on this website is not intended for residents of certain jurisdictions, including the United States, Singapore, Australia, China, Russia, and jurisdictions listed on the FATF and EU/UN sanctions lists. It is not intended for distribution or use where such distribution or use would be contrary to local law or regulation. While the Authority has granted a securities or derivatives investment business licence to the Licensee, it does not endorse the products offered.
Finzero Cap Ltd, registered in the Republic of Cyprus with registration number HE414308 and registered address at 62 Athalassas, Mezzanine, Strovolos 2012, Nicosia, Cyprus.
Copyright © 2024 PU Prime.
