PU Prime App
Exclusive deals on mobile


PU Prime App
Exclusive deals on mobile
Tenir les marchés mondiaux entre vos mains
Notre application de trading pour mobile est compatible avec la plupart des appareils intelligents. Téléchargez l’application dès maintenant et commencez à trader avec PU Prime sur tout appareil, à tout moment et en tout lieu.


20 February 2024,02:04
Daily Market Analysis
20 February 2024, 02:04


January’s inflation exceeds expectations at 0.30% monthly and 3.10% year-on-year, reinforcing the Dollar’s strength.
The Dollar Index hits a three-month high, driven by robust economic indicators, including strong job reports, GDP figures and US inflation. January’s inflation exceeds expectations at 0.30% monthly and 3.10% year-on-year, reinforcing the Dollar’s strength. Market expectations for Federal Reserve policy shift, with no March rate cut, less than a 50% chance in May, and an 80% probability for a June cut. The Dollar’s ascendancy prompts a significant downturn in gold prices, while oil remains resilient, supported by optimistic OPEC projections and geopolitical tensions. In equities, a sharp retreat follows bullish momentum, influenced by rising US Treasury yields and revised expectations of sustained higher interest rates from the Federal Reserve
Current rate hike bets on 20th March Fed interest rate decision:
Source: CME Fedwatch Tool
0 bps (92%) VS -25 bps (8%)

(MT4 System Time)

Source: MQL5
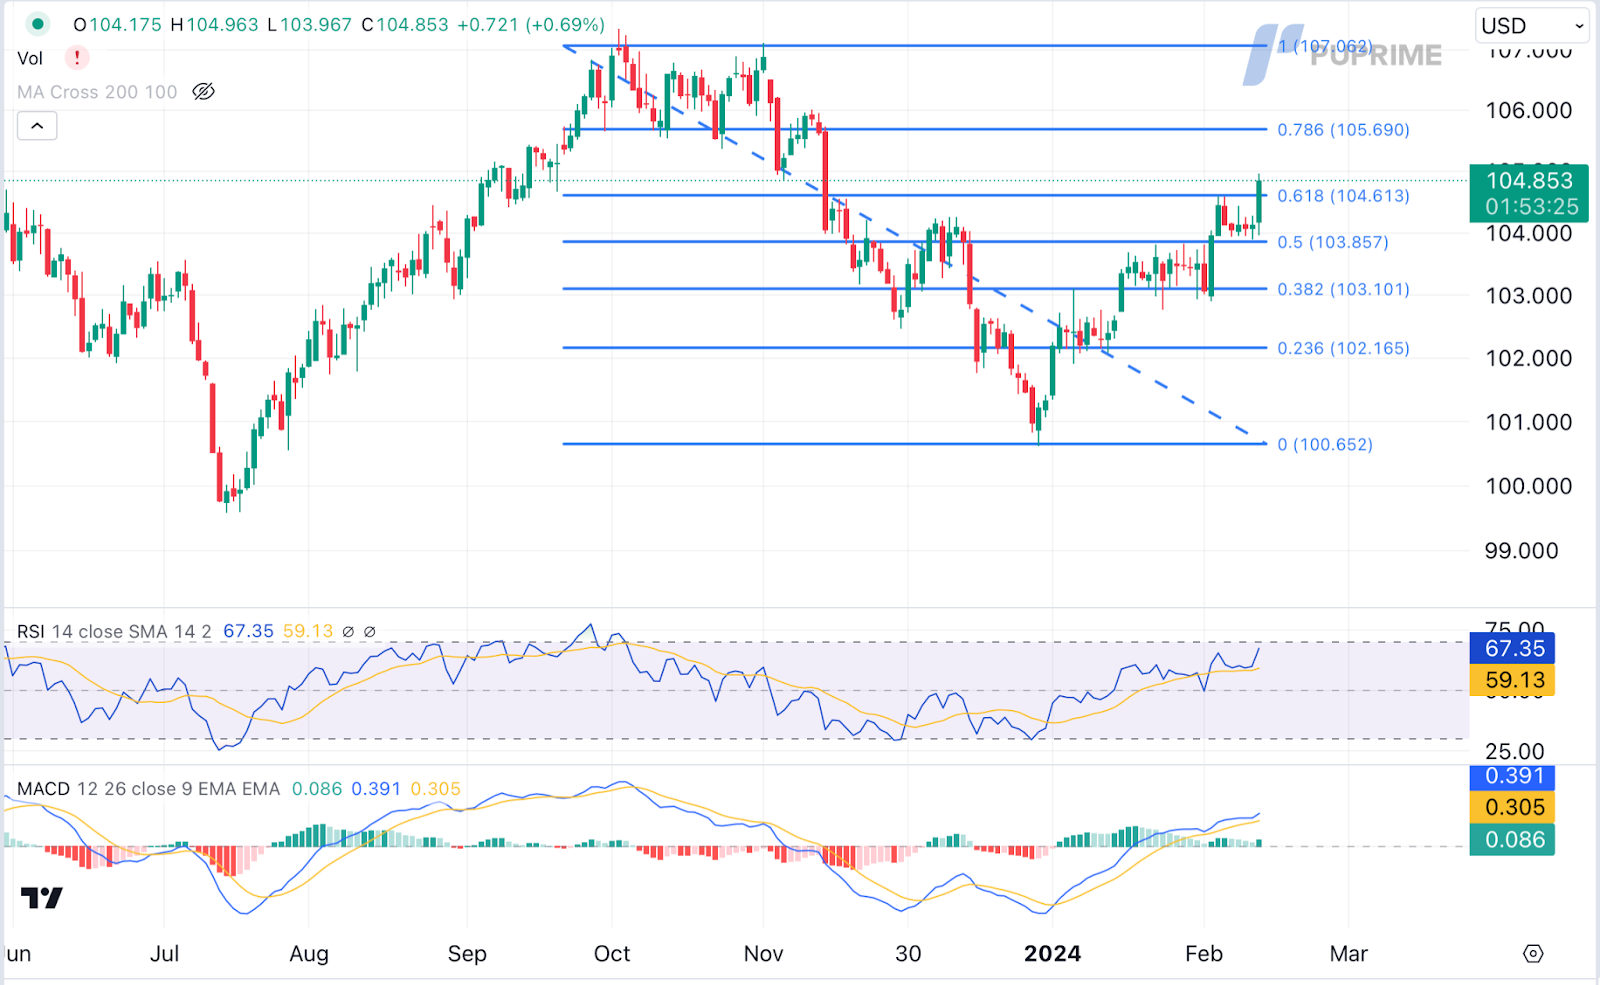
The Dollar Index has aggressively climbed to a three-month high, propelled by better-than-expected economic indicators. Positive data, including an optimistic jobs report and GDP figures, contributed to a January inflation increase surpassing expectations. The US Consumer Price Index (CPI) rose by 0.30% monthly and 3.10% year-on-year, exceeding economist estimates.
The Dollar Index is trading higher following the prior breakout above the previous resistance level. MACD has illustrated increasing bullish momentum, while RSI is at 67, suggesting the index might extend its gains since the RSI stays above the midline.
Resistance level: 105.70, 107.05
Support level: 103.85, 103.10
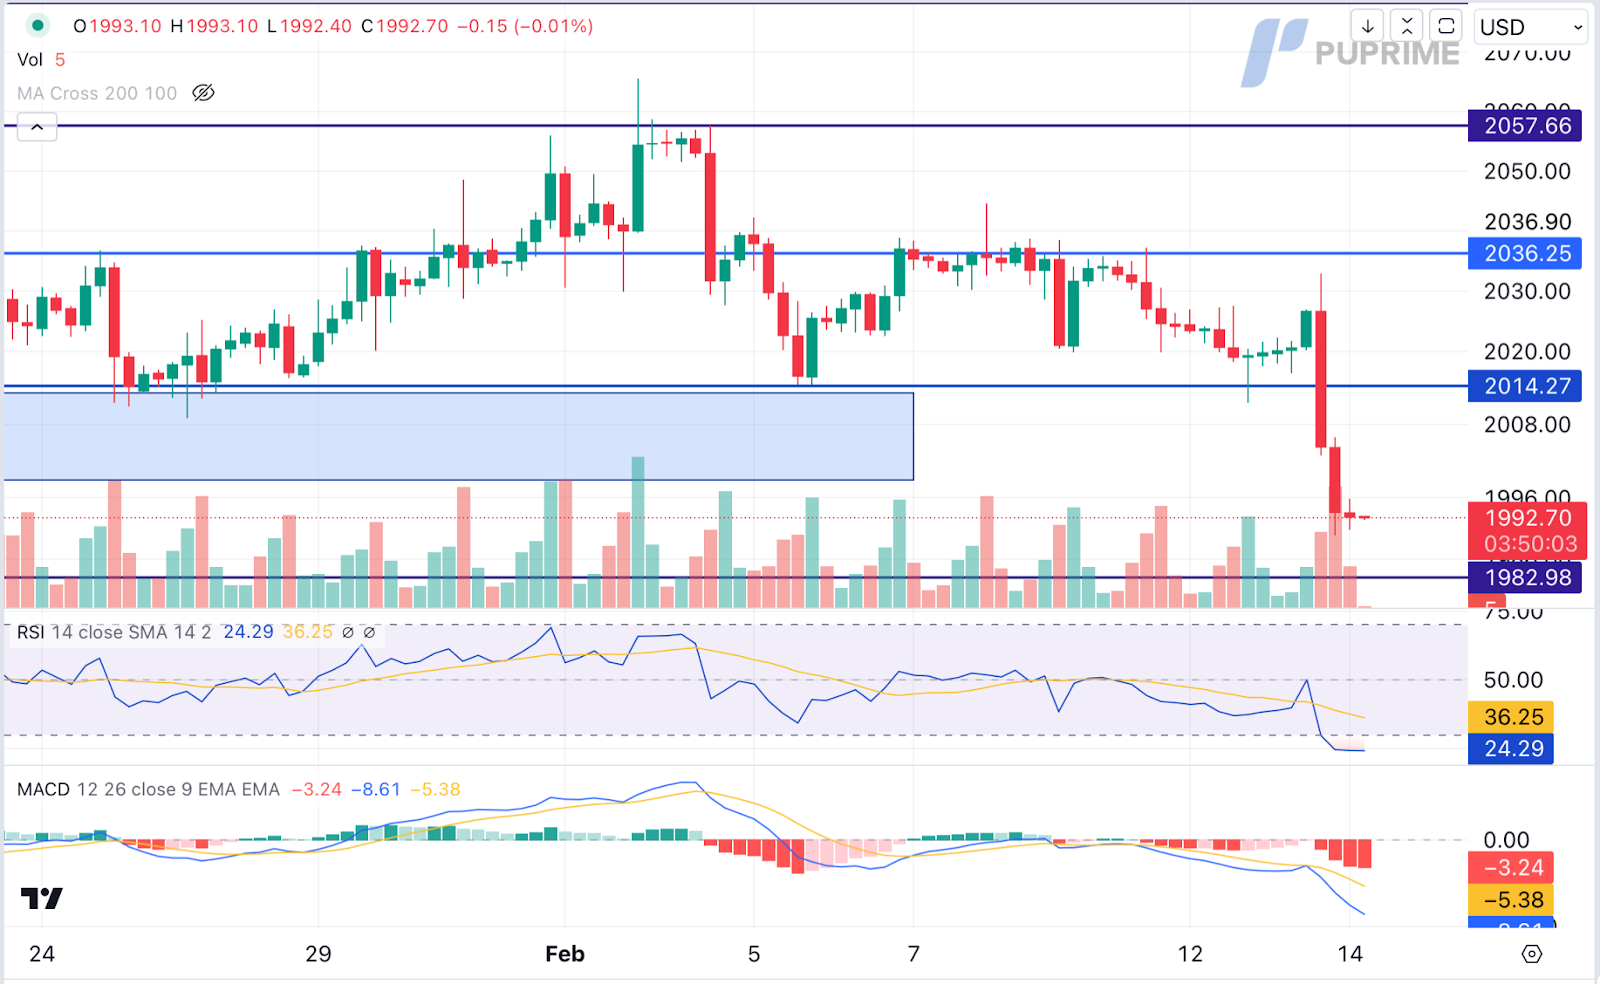
Gold prices experienced a significant tumble due to the strengthening US Dollar. The series of upbeat economic data, coupled with rising Treasury yields, has led market participants to anticipate a delay in Fed rate cut policies, influencing demand for the dollar-denominated gold.
Gold prices are trading lower following the prior retracement from the resistance level. MACD has illustrated increasing bearish momentum. However, RSI is at 24, suggesting the commodity might enter oversold territory.
Resistance level: 2015.00, 2035.00
Support level: 1985.00, 1970.00
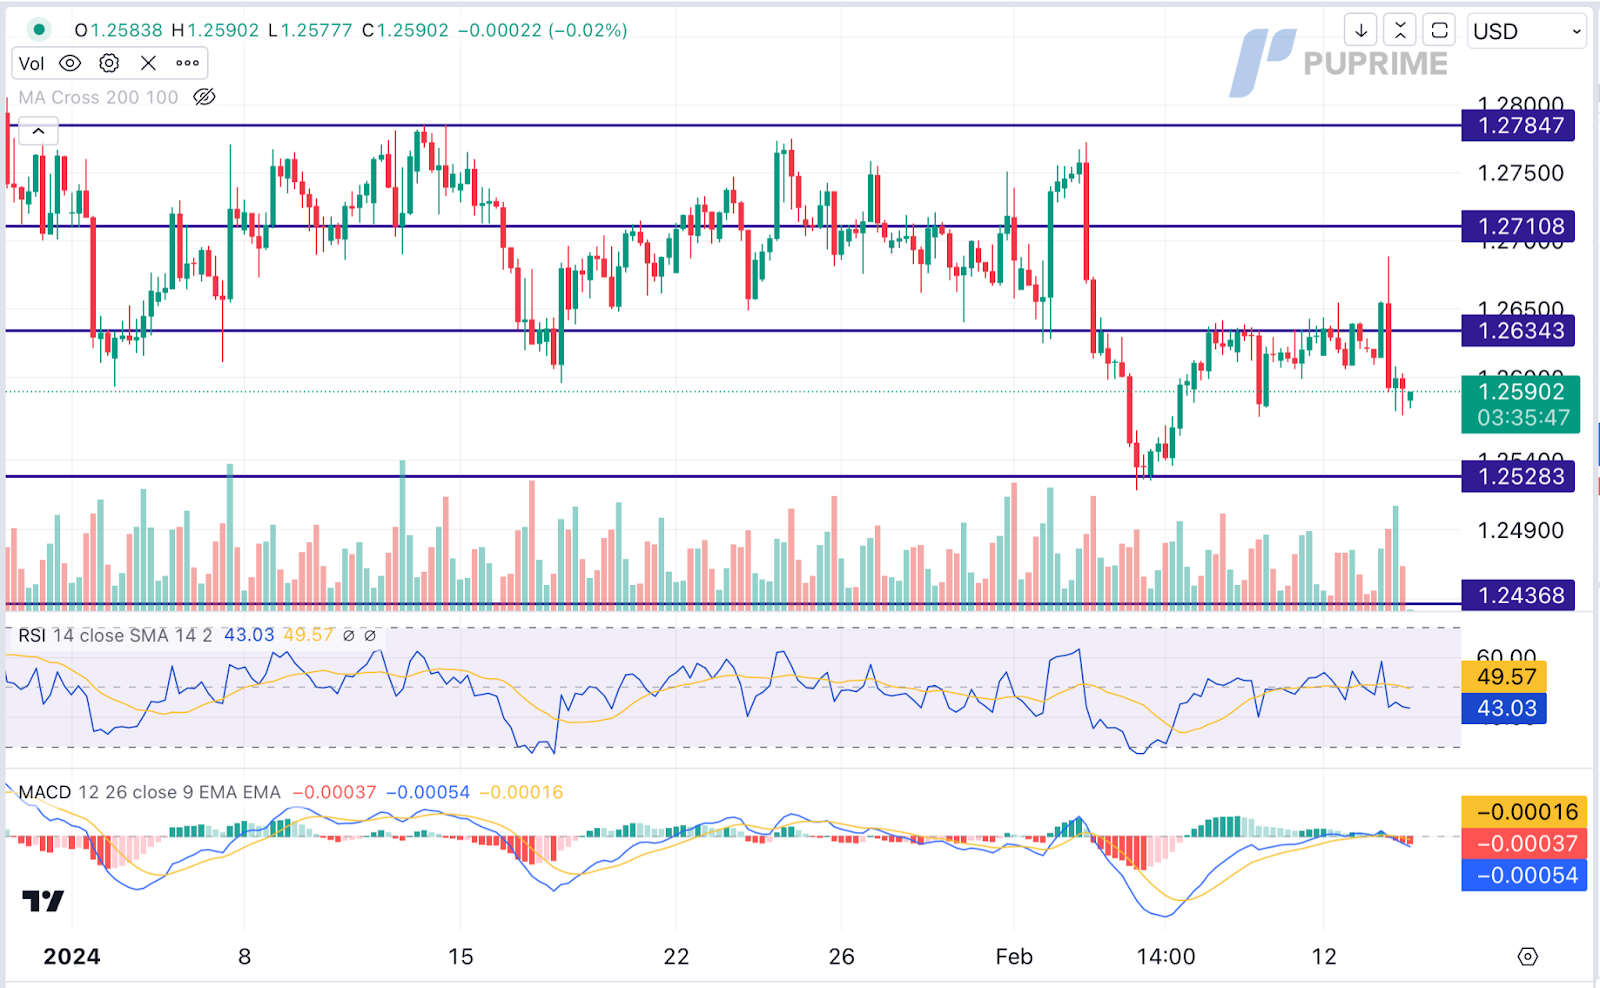
GBP/USD experienced a bearish trend due to the absence of market catalysts from the UK region. The appreciation of the US Dollar, driven by better-than-expected US economic data, led investors to reconsider the possibilities of a delayed rate cut from the Federal Reserve, increasing demand for the US Dollar. Moving ahead, investors are advised to continue monitoring the UK CPI report for further trading signals.
GBPUSD is trading lower following the prior retracement from the resistance level. MACD has illustrated increasing bearish momentum, while RSI is at 43, suggesting the pair might extend its losses since the RSI stays below the midline.
Resistance level: 1.2635, 1.2710
Support level:1.2530, 1.2435
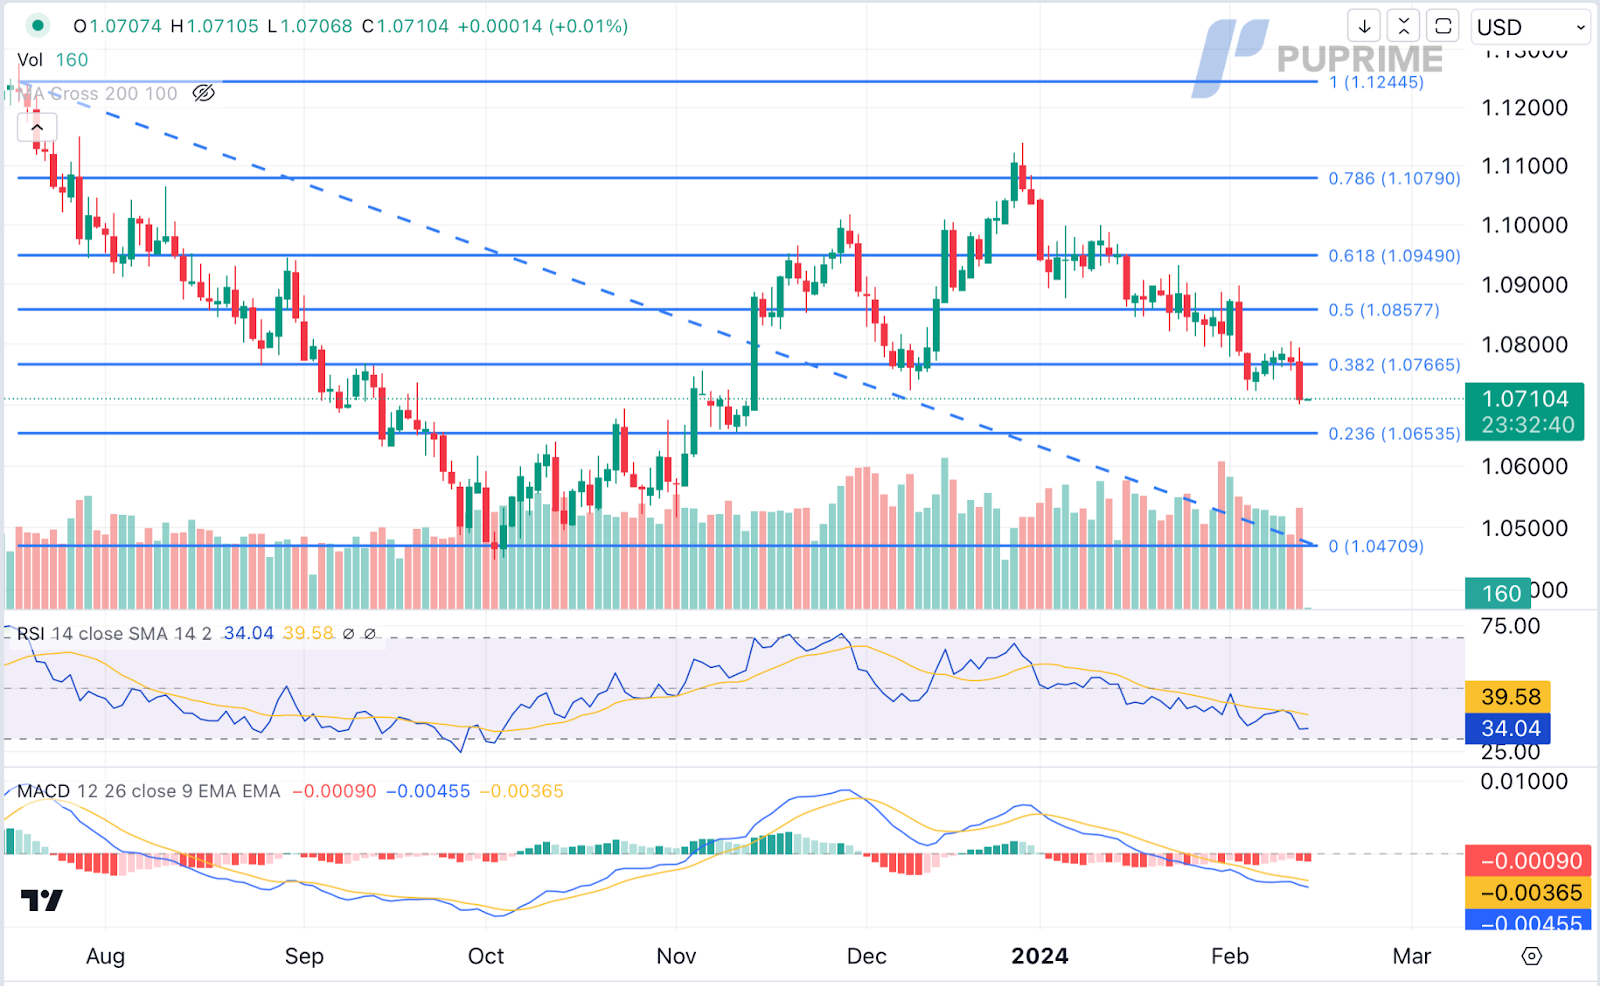
EUR/USD faced aggressive selling pressure after a notable resurgence in the US Dollar. The revived demand for the Greenback was fueled by a significantly better-than-expected inflation report, leading investors to consider the possibility of the Federal Reserve delaying its monetary easing program. This stands in contrast to the monetary decisions of the European Central Bank. On the EU front, ZEW officials reported a decline in respondents’ evaluation of the current economic situation to its lowest point since June 2020, signalling concerns for the German economy.
EUR/USD is trading lower following the prior breakout below the previous support level. MACD has illustrated increasing bearish momentum, while RSI is at 34, suggesting the pair might extend its losses since the RSI stays below the midline.
Resistance level: 1.0765, 1.0855
Support level: 1.0655, 1.0470
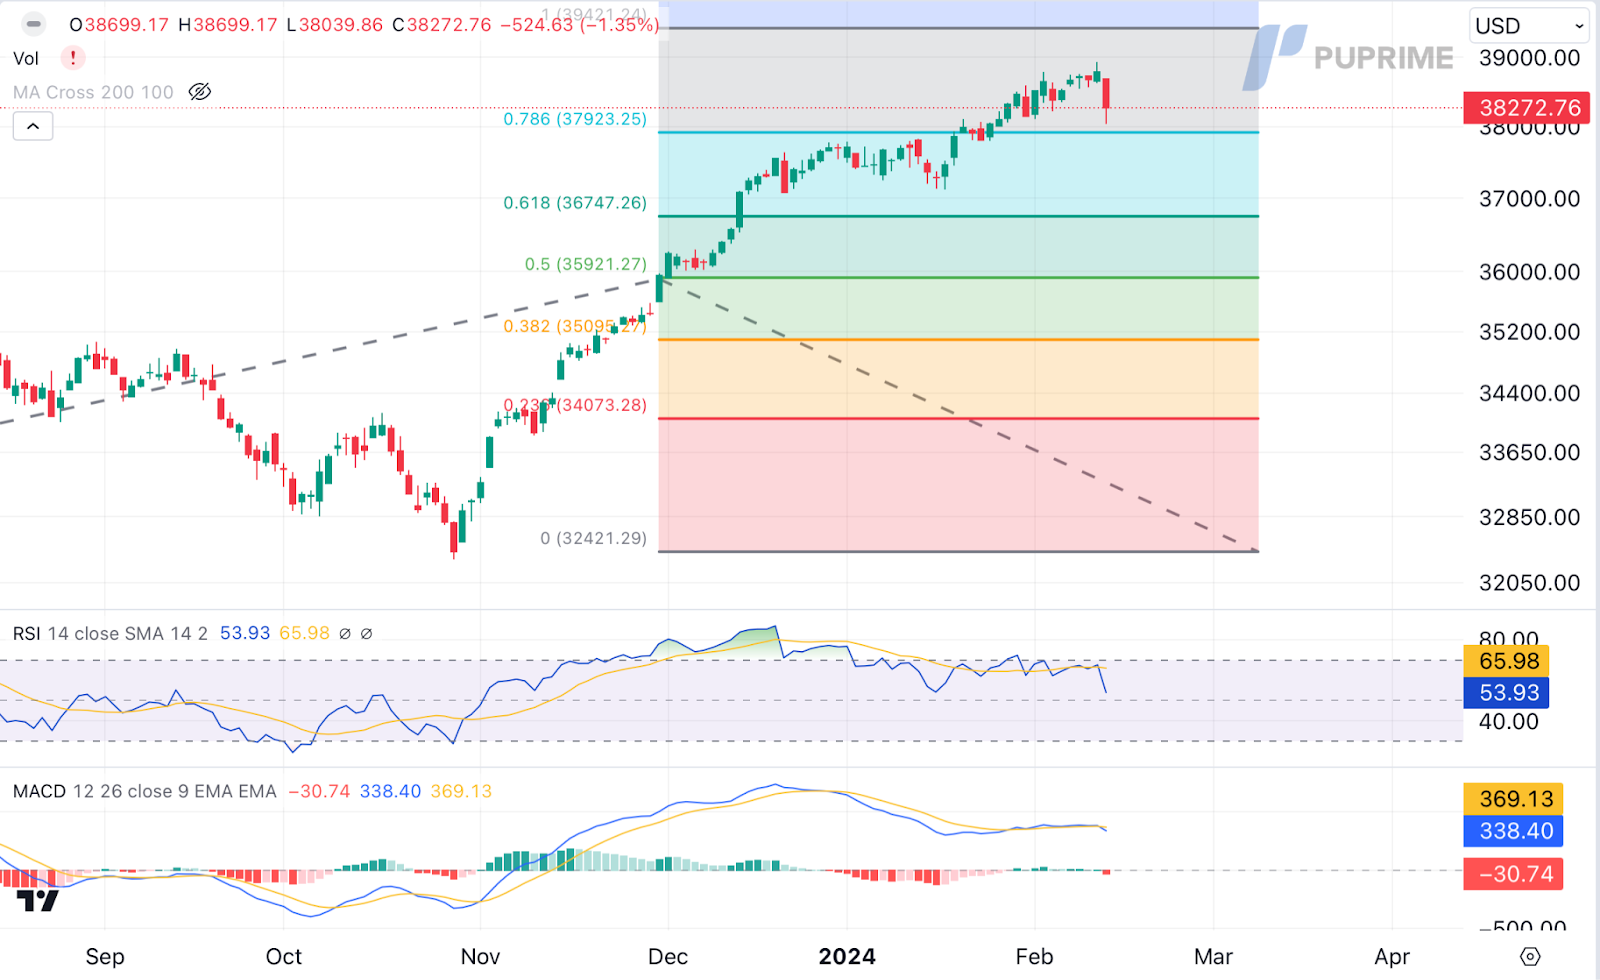
Despite the earlier bullish momentum, the US equity market began a sharp retreat. Rising US Treasury yields and the expectation that the Fed might maintain higher interest rates prompted technical corrections and profit-taking. The recent economic data has led investors to reassess their positions.
Dow Jones is trading lower while currently testing the support level. MACD has illustrated increasing bearish momentum, while RSI is at 54, suggesting the index might extend its losses since the RSI stays below the midline.
Resistance level: 39420.00, 40000.00
Support level: 37925.00, 36745.00
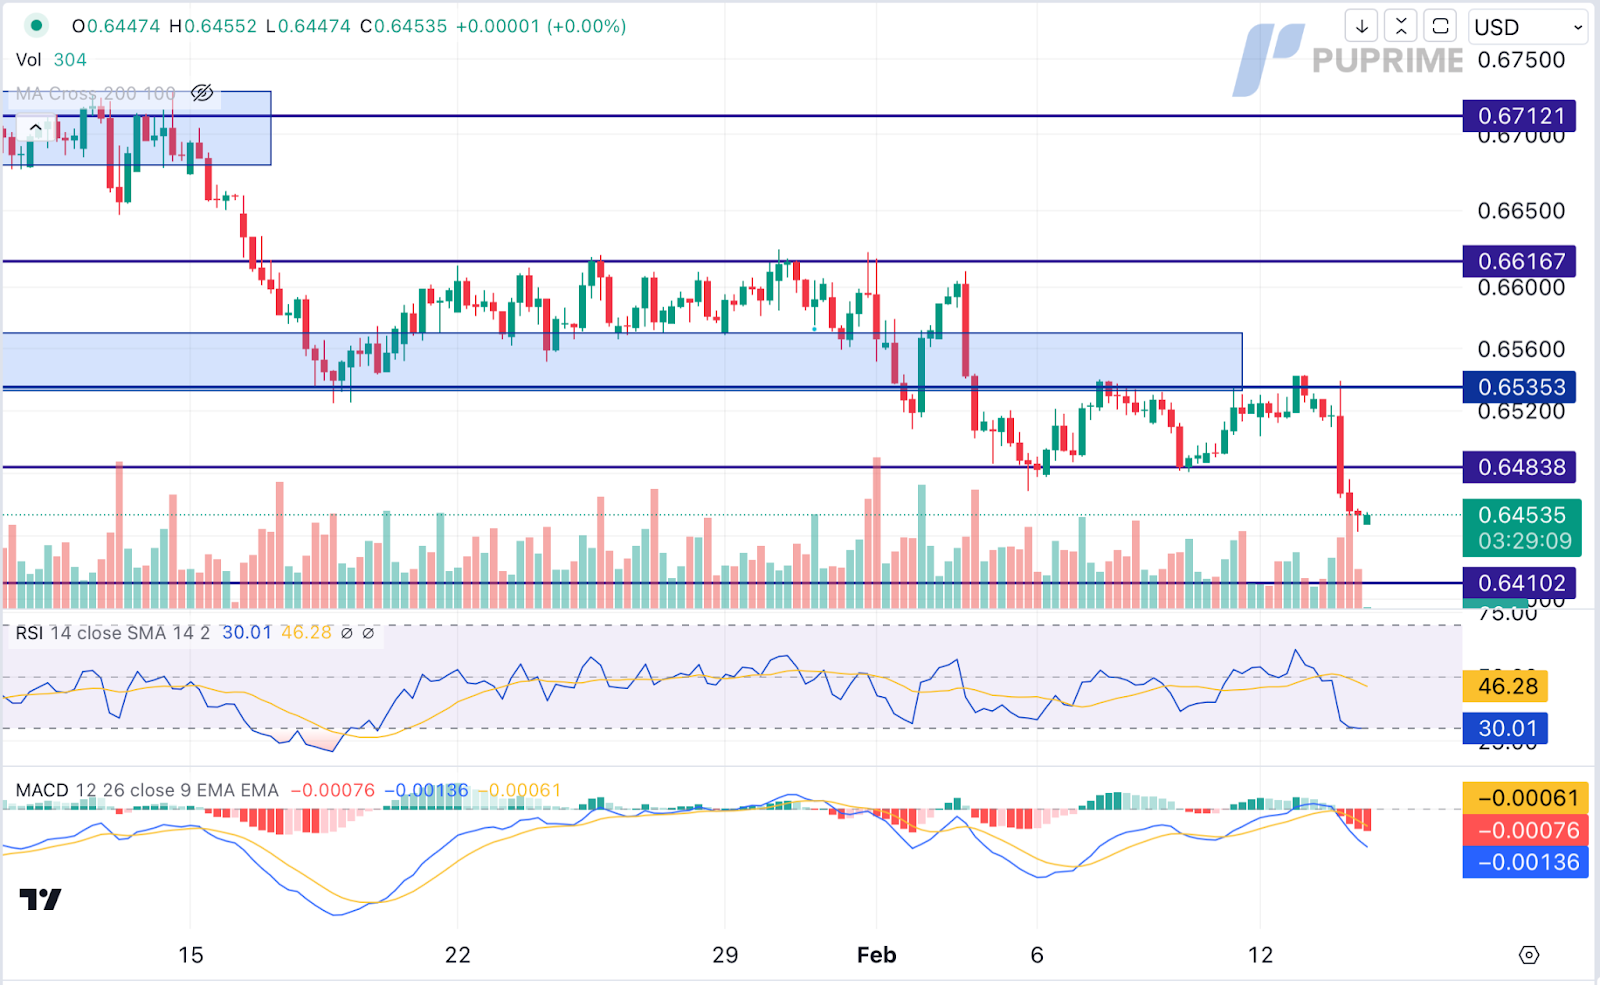
AUD/USD faced renewed selling pressure amid a sudden and strong rebound in the US Dollar, exacerbated by higher-than-expected US inflation figures in January. The robust inflation report prompted a repricing of expectations for a potential rate cut by the Federal Reserve, now anticipated later than initially expected. On the Australia front, the Reserve Bank of Australia (RBA) slightly revised downward its inflation forecasts, projecting both indicators to remain below 3% by the fourth quarter of 2025. Simultaneously, the RBA lowered its GDP growth projections, reflecting a less optimistic outlook for the Australian economy.
AUD/USD is trading higher while currently testing the resistance level. However, MACD has illustrated diminishing bullish momentum, while RSI is at 51, suggesting the pair might experience technical correction since the RSi retreated sharply from overbought territory.
Resistance level: 0.6535, 0.6615
Support level: 0.6485, 0.6410
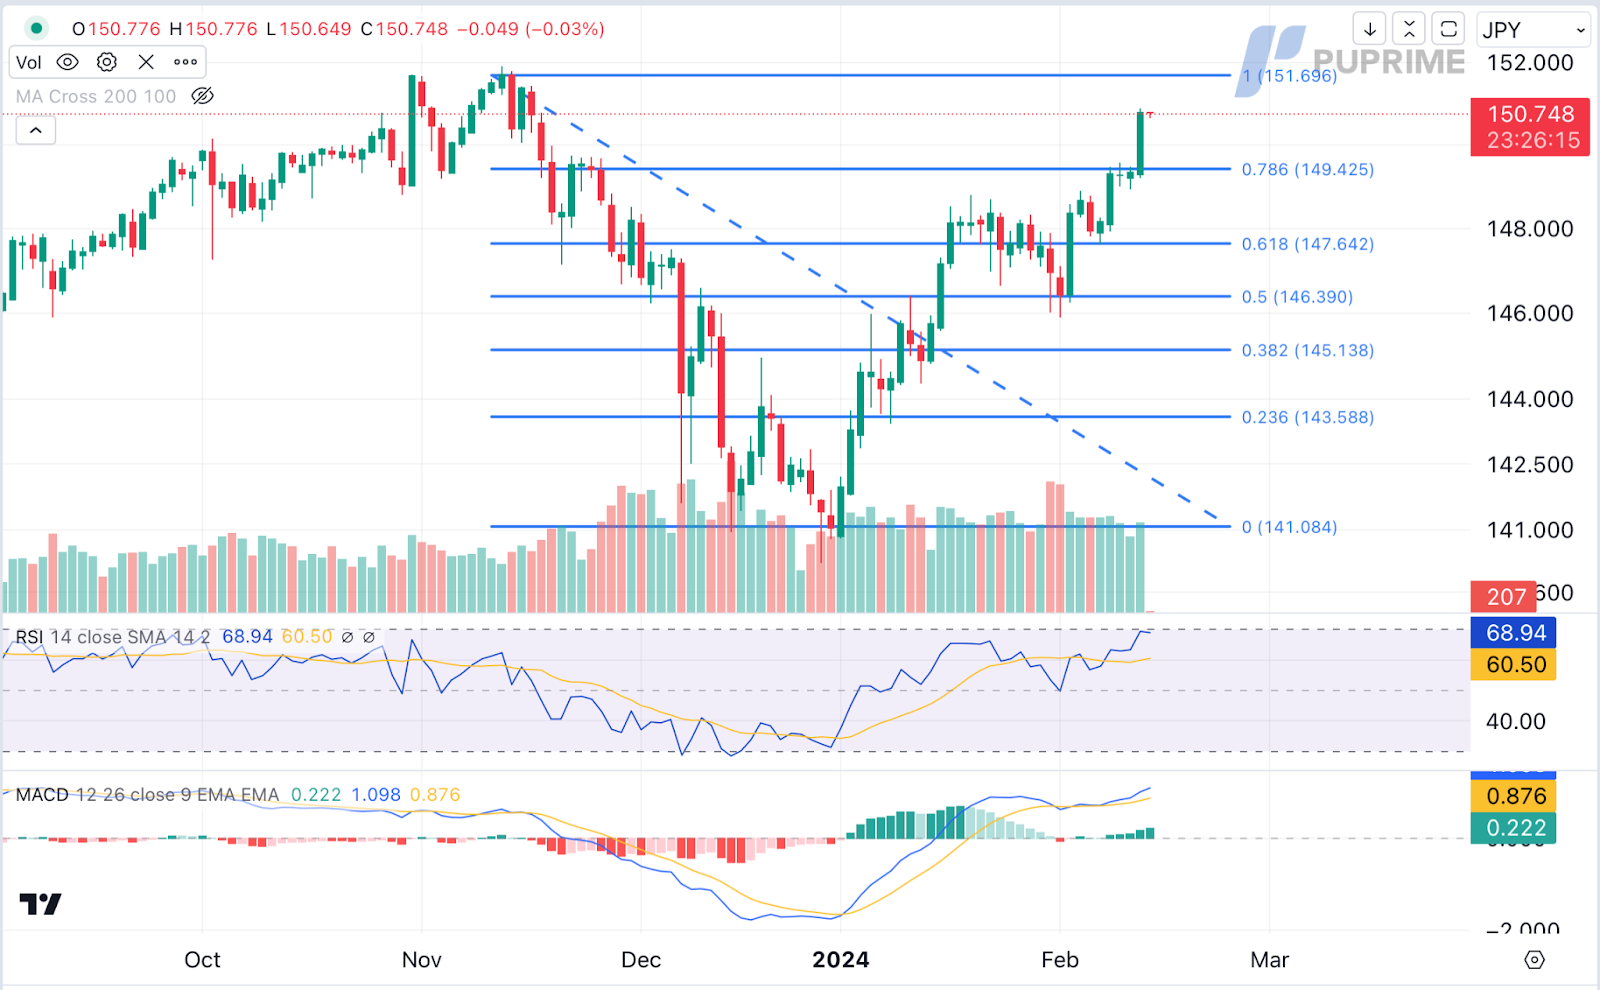
USD/JPY surged to a three-month peak following the release of the US Bureau of Labor Statistics (BLS) data, revealing that US inflation, while slowing down, remains above the 3% threshold. This persistent inflation report has been a catalyst for lifting US Treasury yields, further widening the yield differential between Japanese and US markets. The US Consumer Price Index (CPI) exceeded expectations, growing by 3.1% year-on-year, albeit slightly below last month’s 3.4% reading.
USD/JPY is trading higher following the prior breakout above the resistance level. MACD has illustrated increasing bullish momentum, while RSI is at 69, suggesting the pair might extend its gains since the RSI stays above the midline.
Resistance level: 151.70, 152.50
Support level: 149.45, 147.65
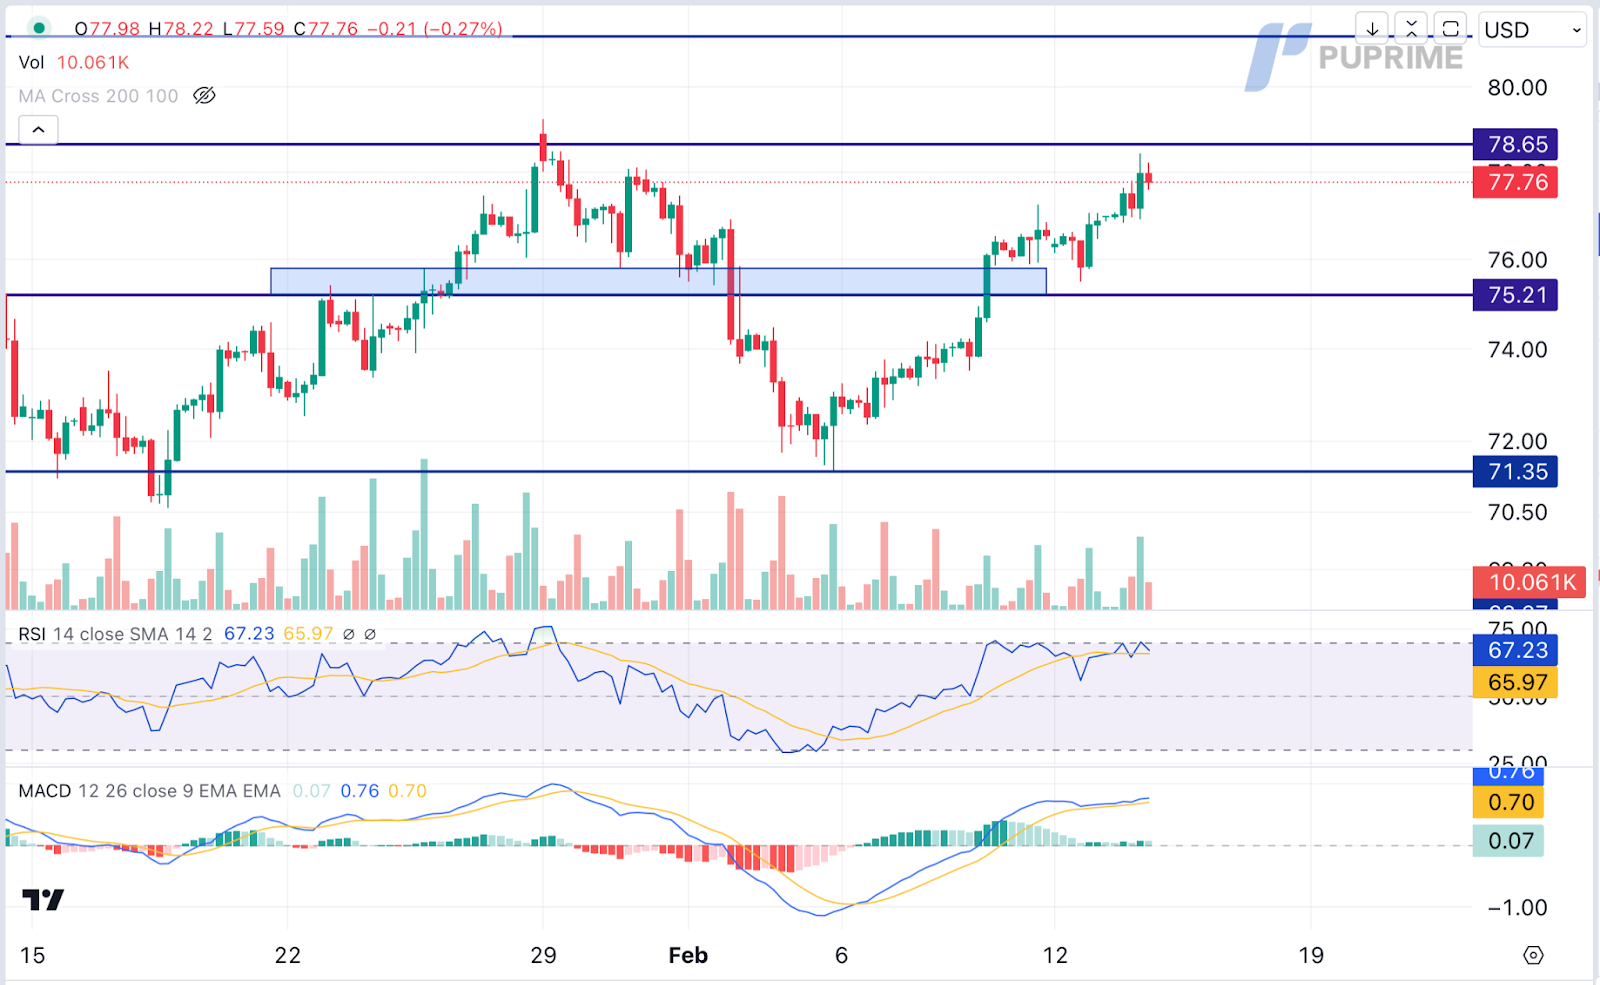
Oil prices maintained their bullish trajectory despite a stronger US Dollar. Ongoing geopolitical tensions and an optimistic demand outlook counterbalanced the impact of the dollar surge. OPEC’s positive outlook, expecting a 2.2 million barrel per day rise in crude oil demand for the year, contributes to a supportive oil market, while geopolitical concerns, including Gaza ceasefire talks, remain on the radar.
Oil prices are trading higher following the prior breakout above the resistance level. However, MACD has illustrated diminishing bullish momentum, while RSI is at 67, suggesting the commodity might experience technical correction since the RSI retreated sharply from overbought territory.
Resistance level: 78.65, 81.20
Support level: 75.20, 71.35

Tradez le Forex, les indices, Métaux et plus encore avec des spreads faibles et une exécution ultra-rapide.
Inscrivez-vous pour un compte réel PU Prime grâce à notre procédure simplifiée.
Approvisionnez facilement votre compte grâce à un large éventail de canaux et de devises acceptées.
Accédez à des centaines d’instruments avec les meilleures conditions de trading.
Plaquettes de trading
Entreprise
FAQs
Application PU Prime - Commencez à trader avec un avantage


Risk Warning: Trading Contract for Difference (CFD) carries a high level of risk to your capital and may result in losses that exceed your deposits due to leverage. It's important to understand how CFDs work and assess whether you can afford the high risk of losing your money. When acquiring our derivative products, you do not own or have rights in the underlying assets. Past performance is not indicative of future results. The information on this website is general and does not take into account your personal objectives, financial circumstances, or needs. Seek independent advice from qualified experts if necessary, and ensure you fully understand the risks before making any trading decisions.
PU Prime is a brand name of different entities authorised and registered in various jurisdictions.
PU Prime Limited is authorized and regulated by the Financial Services Authority of Seychelles under License No. SD050, with registered address at CT House, Office 1A, Providence, Mahe, Seychelles.
PU Prime Ltd is authorized and regulated by the Financial Services Commission of Mauritius under License No. GB23202672, with registered address at Suite 201 Level 2, The Catalyst Building, 40 Silicon Avenue, Cybercity Ebene, Mauritius.
PU Prime (Pty) Ltd is an authorised Financial Services Provider registered and regulated by the Financial Sector Conduct Authority of South Africa under License No. 52218, with registered address at 37 Harley Street, Ferndale, Randburg, Gauteng, South Africa.
The information on this website is not intended for residents of certain jurisdictions, including the United States, Singapore, Australia, China, Russia, and jurisdictions listed on the FATF and EU/UN sanctions lists. It is not intended for distribution or use where such distribution or use would be contrary to local law or regulation. While the Authority has granted a securities or derivatives investment business licence to the Licensee, it does not endorse the products offered.
Finzero Cap Ltd, registered in the Republic of Cyprus with registration number HE414308 and registered address at 62 Athalassas, Mezzanine, Strovolos 2012, Nicosia, Cyprus.
Copyright © 2024 PU Prime.
