PU Prime App
Exclusive deals on mobile


PU Prime App
Exclusive deals on mobile
Tenir les marchés mondiaux entre vos mains
Notre application de trading pour mobile est compatible avec la plupart des appareils intelligents. Téléchargez l’application dès maintenant et commencez à trader avec PU Prime sur tout appareil, à tout moment et en tout lieu.


19 April 2024,06:39
Daily Market Analysis
19 April 2024, 06:39


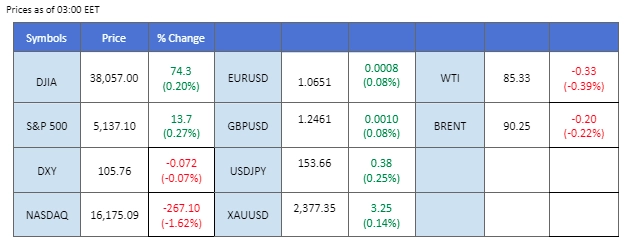
Gold surged past $2400 per troy ounce, hitting record highs driven by geopolitical tensions and global uncertainty before retracing as technical indicators signalled overheating, prompting profit-taking. Despite this, gold saw a remarkable 20% surge since mid-February, catching investors off guard amid talks of Federal Reserve interest rate cuts. Geopolitical tensions escalated as Iran launched a significant attack on Israel, utilising over 300 drones and missiles, driving up demand for safe-haven assets. The US Dollar strengthened on improved economic data, diminishing hopes of rate cuts, while oil prices consolidated around positive levels following Iran’s attack, with further gains dependent on Israel’s response and potential G7 actions targeting Iranian crude oil exports.
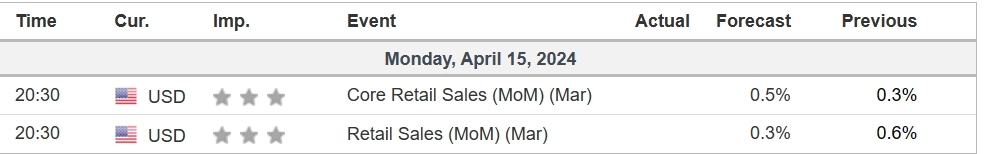
Current rate hike bets on 1st May Fed interest rate decision:
Source: CME Fedwatch Tool
0 bps (97%) VS -25 bps (3%)
(MT4 System Time)
Source: MQL5
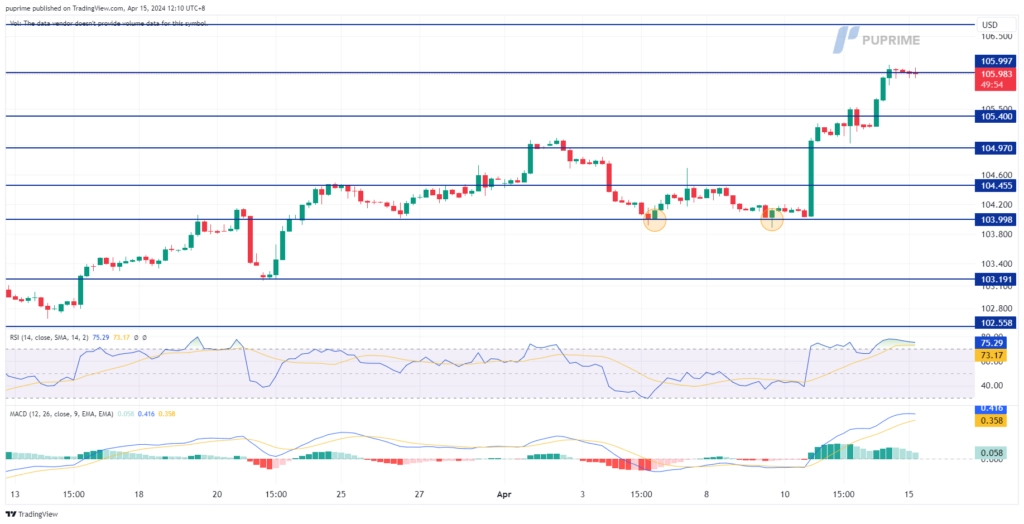
The US Dollar received further bullish momentum amidst improved economic data, diminishing hopes of Federal Reserve rate cuts. Better-than-expected indicators from the US region, coupled with a hawkish tone from Federal Reserve members, bolstered the currency’s strength amid weak global risk appetite.
The Dollar Index is trading higher while currently testing the resistance level. However, MACD has illustrated diminishing bullish momentum, while RSI is at 75, suggesting the index might experience technical correction since the RSI retreated sharply from overbought territory.
Resistance level: 106.00, 106.65
Support level: 105.40, 104.95
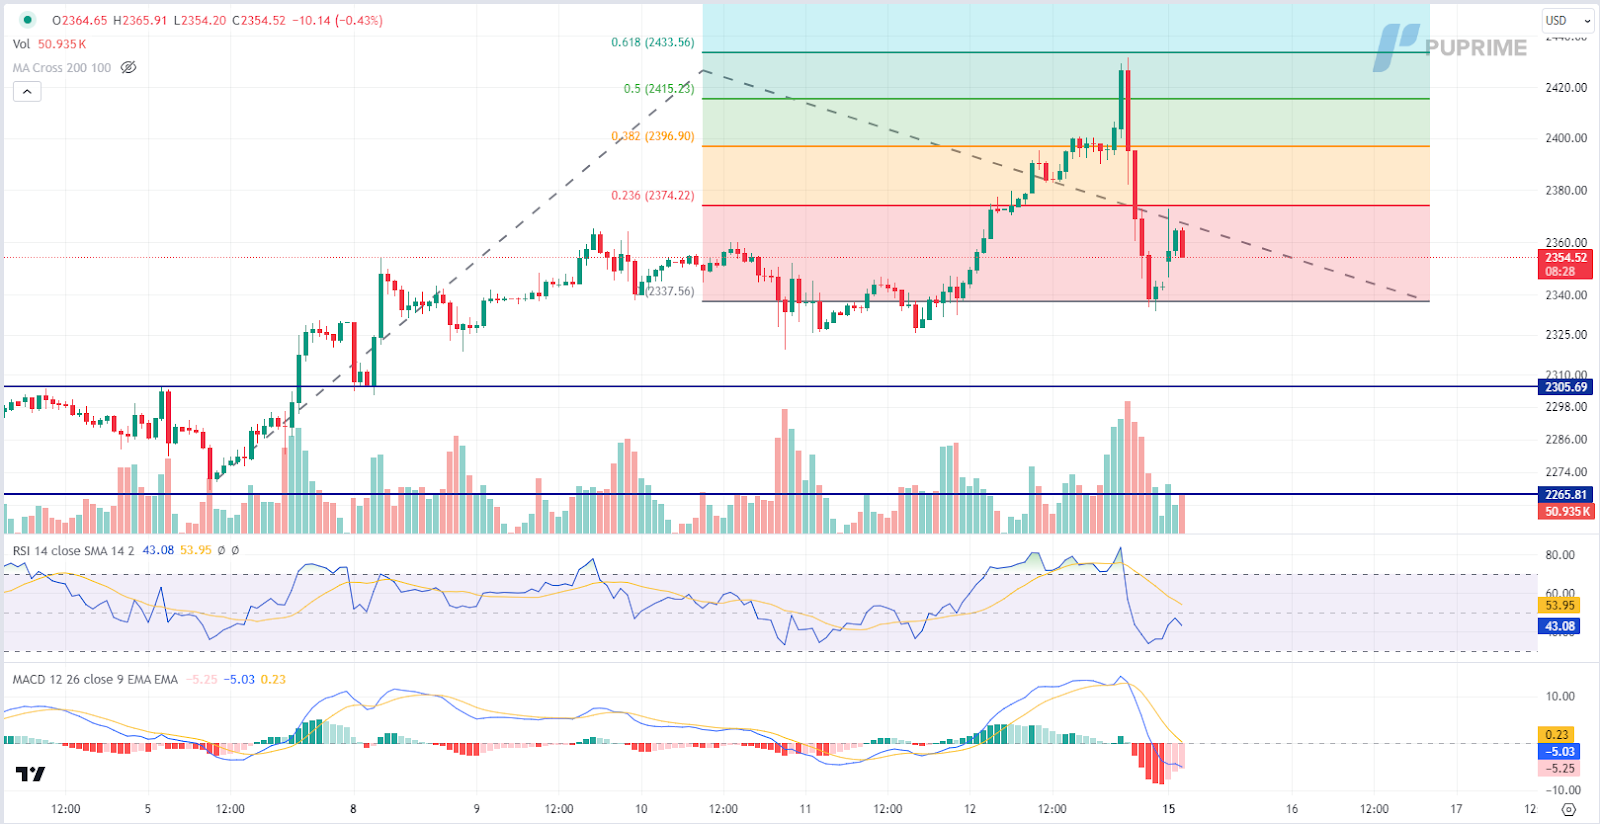
The gold market surged past the crucial $2400 per troy ounce mark, reaching record highs fueled by geopolitical tensions and global uncertainty. However, the rally lost steam as technical indicators signalled overheating, prompting investors to take profit and liquidate positions. Despite this retracement, gold has seen a remarkable 20% surge since mid-February, catching many investors off guard amid persistent talk of Federal Reserve interest rate cuts.
Gold prices are trading higher following the prior breakout above the previous resistance level. MACD has illustrated diminishing bearish momentum, while RSI is at 43, suggesting the commodity might extend its gains since the RSi
Resistance level: 2375.00, 2400.00
Support level: 2335.00, 2305.00
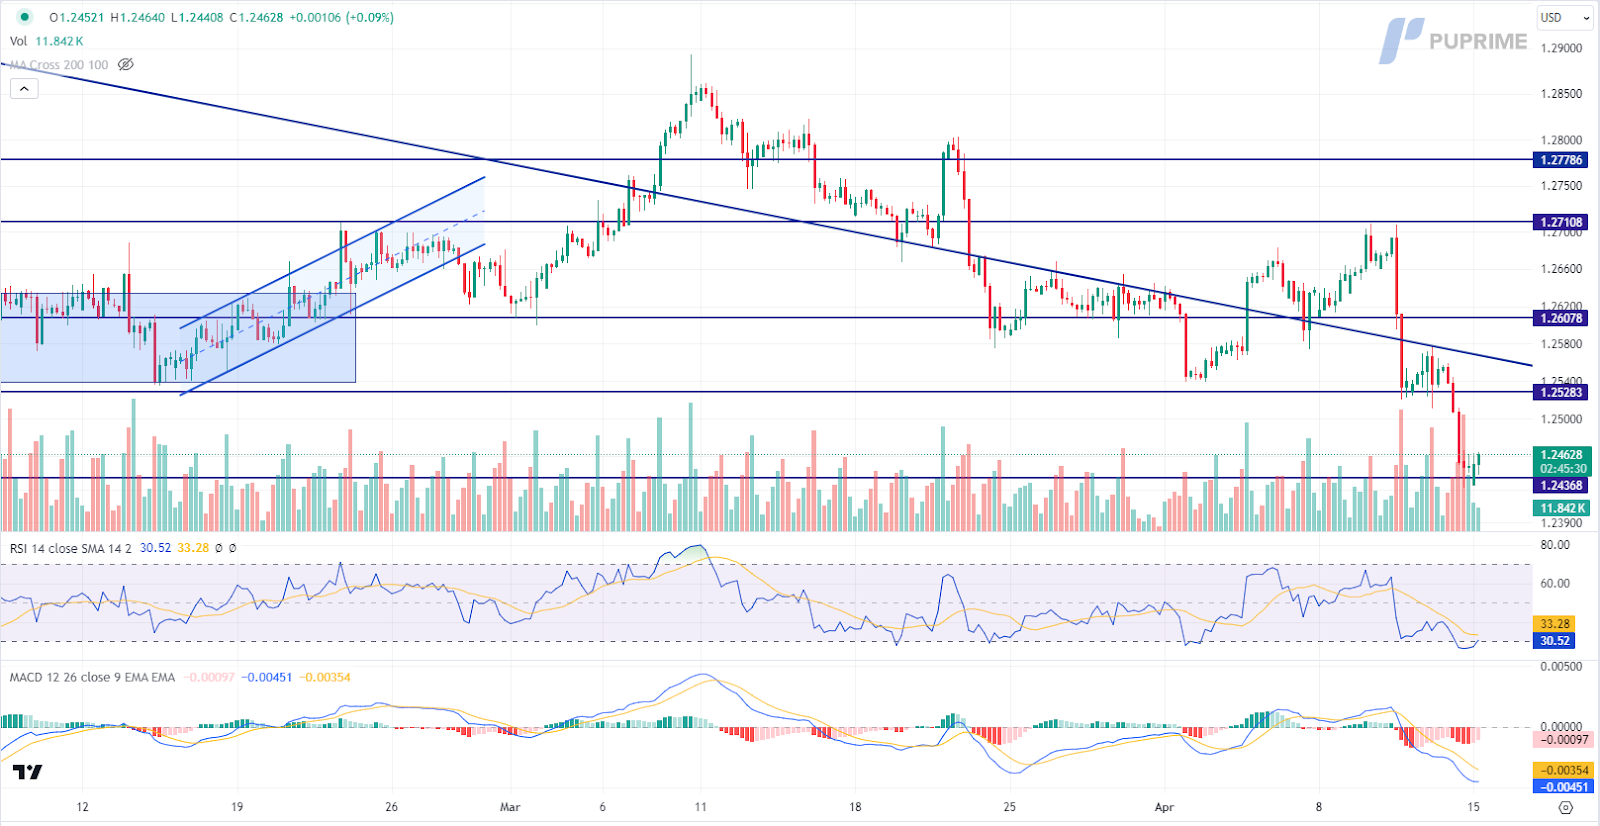
Despite upbeat factory data and the expected increase in monthly Gross Domestic Product (GDP) for February, the Pound Sterling failed to find traction amidst prevailing risk-off sentiment in global markets. The UK GDP expansion of 0.1% in line with expectations indicates a shallow recovery from the technical recession experienced in the second half of 2023. Attention now turns to monetary policy decisions from the Bank of England (BoE), with markets anticipating interest rate reductions starting from August.
GBP/USD is trading lower while currently testing the support level. MACD has illustrated diminishing bearish momentum, while RSI is at 31, suggesting the pair might enter oversold territory.
Resistance level: 1.2530, 1.2610
Support level: 1.2435, 1.2320
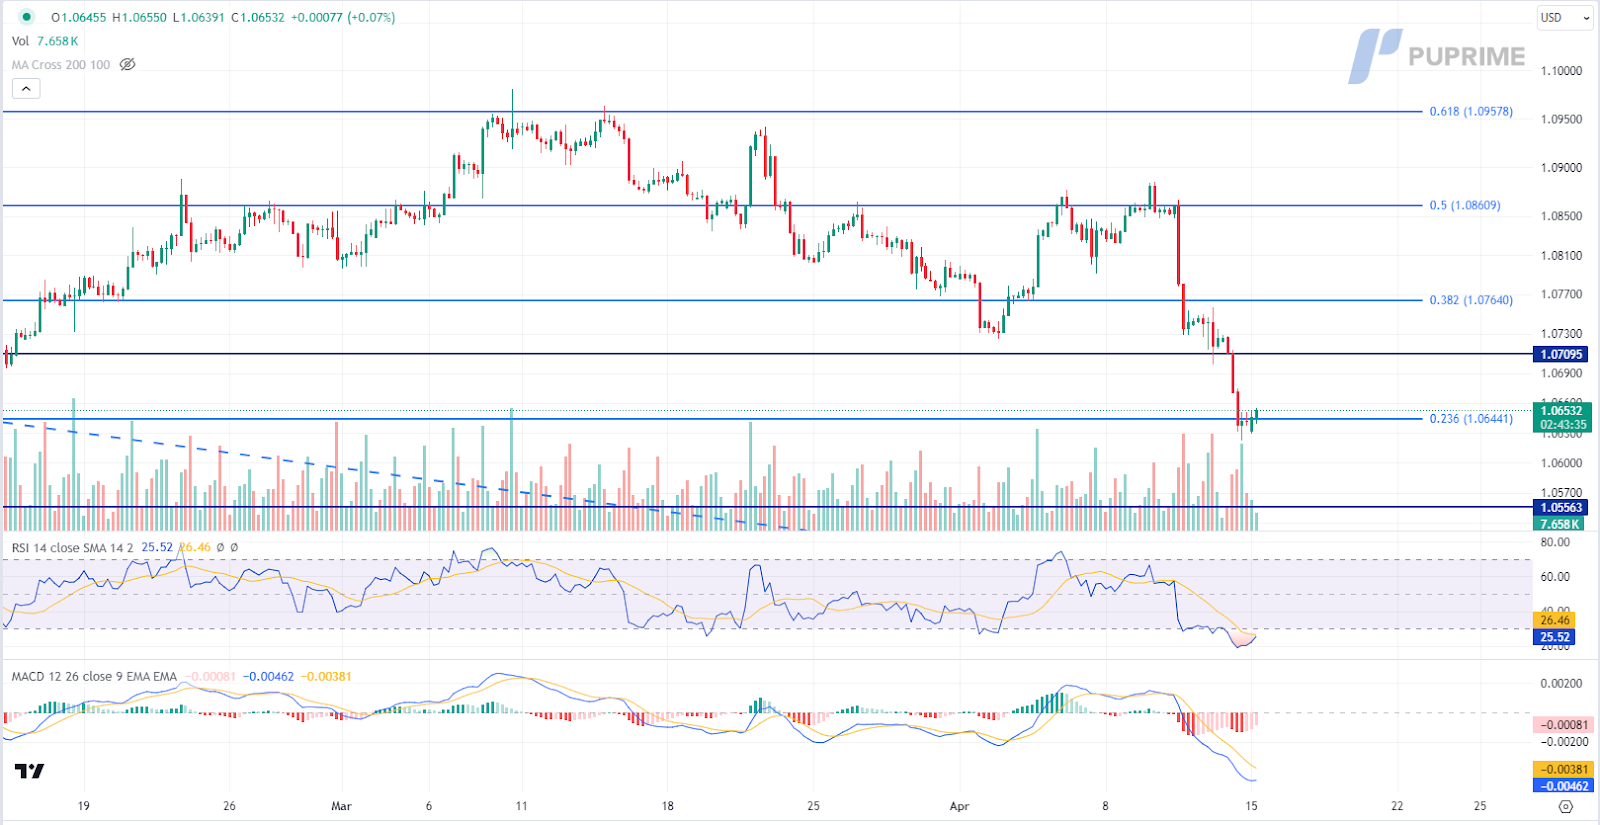
Renewed geopolitical tensions over the weekend exerted pressure on the Euro as safe-haven demand for the Dollar intensified. Iran’s retaliatory actions against a suspected Israeli attack on its consulate in Syria kept markets on edge, despite relative calmness following advanced notice of the attack, which mitigated the risk of further escalation. Uncertainties linger, prompting a sell-off in riskier currencies, as investors monitor developments for trading signals.
EUR/USD is trading lower while currently testing the support level. However, MACD has illustrated diminishing bearish momentum, while RSI is at 25, suggesting the pair might enter oversold territory.
Resistance level: 1.0710, 1.0765
Support level: 1.0645, 1.0555
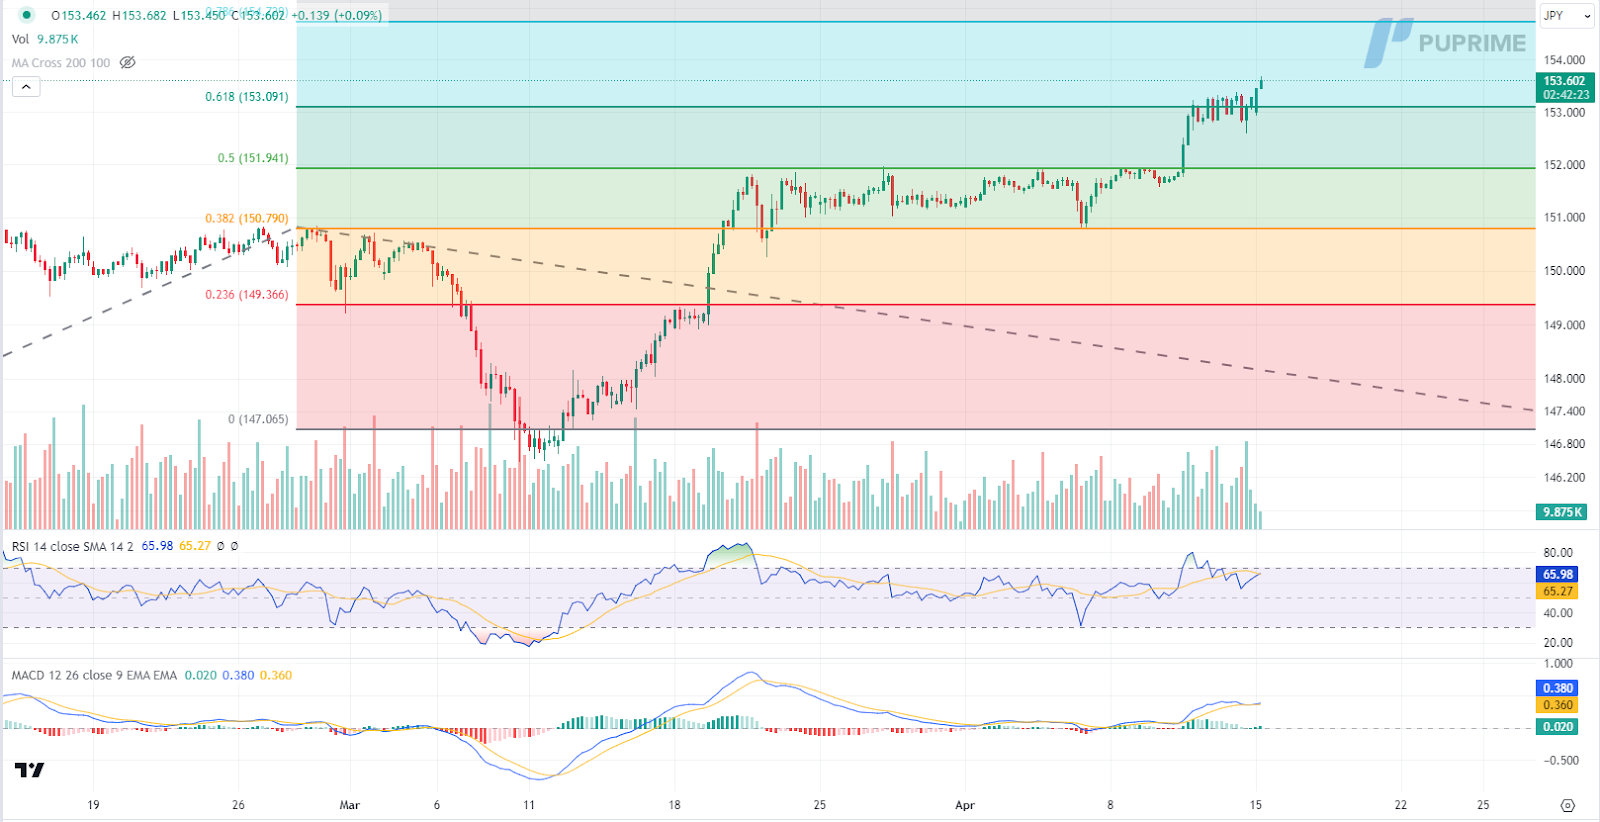
The Japanese yen (JPY) continues its downward trajectory, reaching a fresh multi-decade low during Monday’s Asian session. The Bank of Japan’s (BoJ) dovish stance, signalling no urgency in policy normalisation, remains a key factor suppressing demand for the yen. Conversely, recent data from the US indicating robust economic growth contrasts with the BoJ’s position, widening the gap in US-Japan yield differentials and fueling bullish momentum on USD/JPY.
USD/JPY is trading higher following the prior breakout above the previous resistance level. MACD has illustrated increasing bullish momentum, while RSI is at 66, suggesting the pair might extend its gains since the RSI stays above the midline.
Resistance level: 154.75, 156.80
Support level: 153.10, 151.95
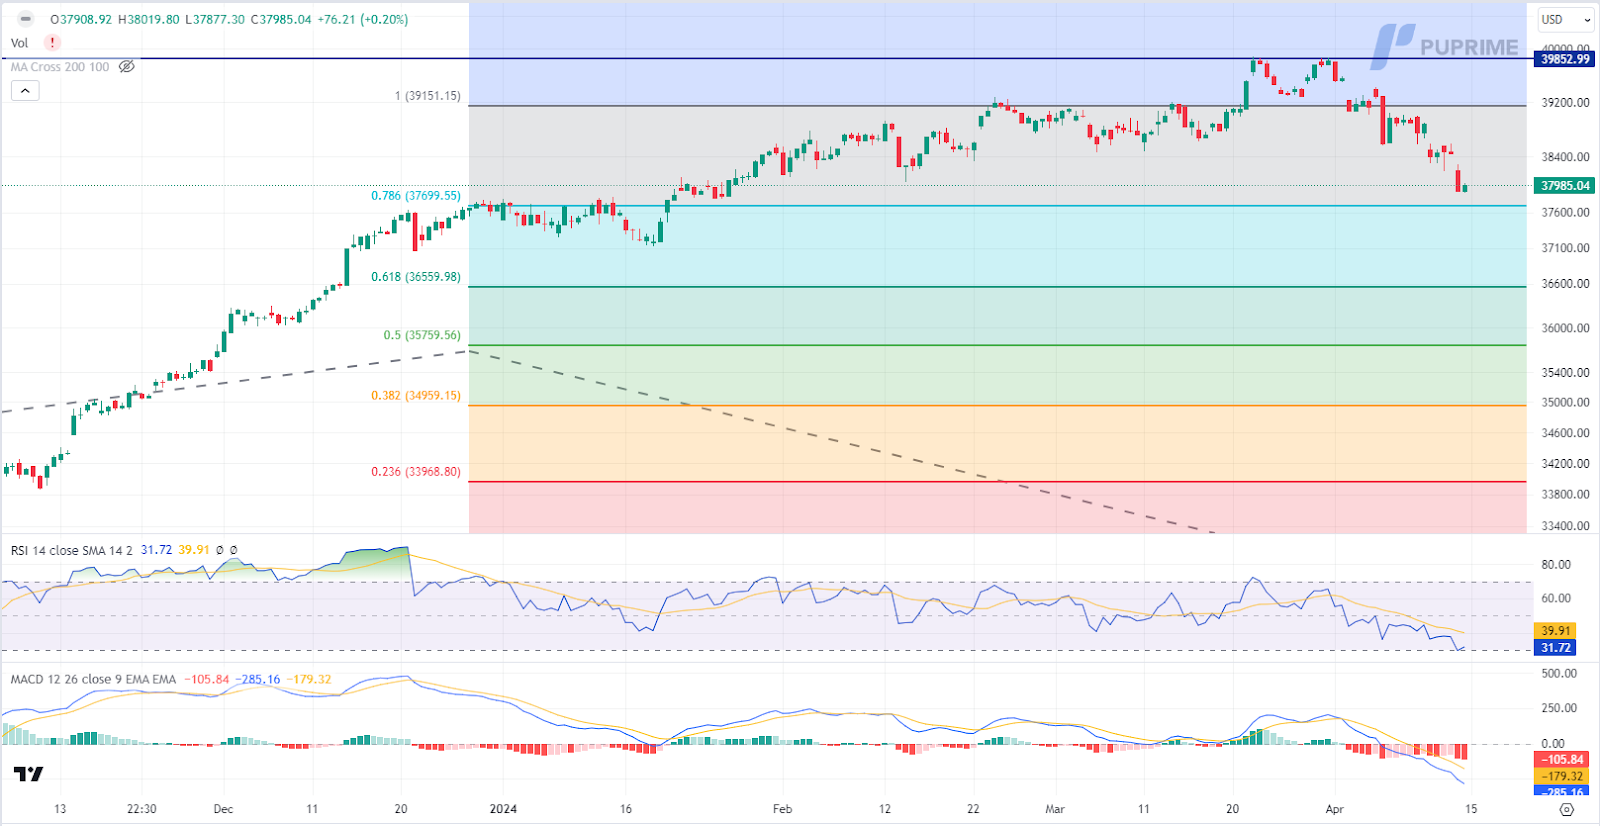
US equity markets edged lower as sticky inflation and positive economic data reduced expectations of Federal Reserve interest rate cuts. Global risk aversion persisted, particularly heightened by escalating tensions in the Middle East following Iran’s attack on Israel, further dampening appetite for high-risk assets like equities.
The Dow is trading lower while currently testing the support level. MACD has illustrated increasing bearish momentum, while RSI is at 32, suggesting the index might extend its losses after breakout since the RSI stays below the midline.
Resistance level: 39150.00, 39855.00
Support level: 37700.00, 36560.00
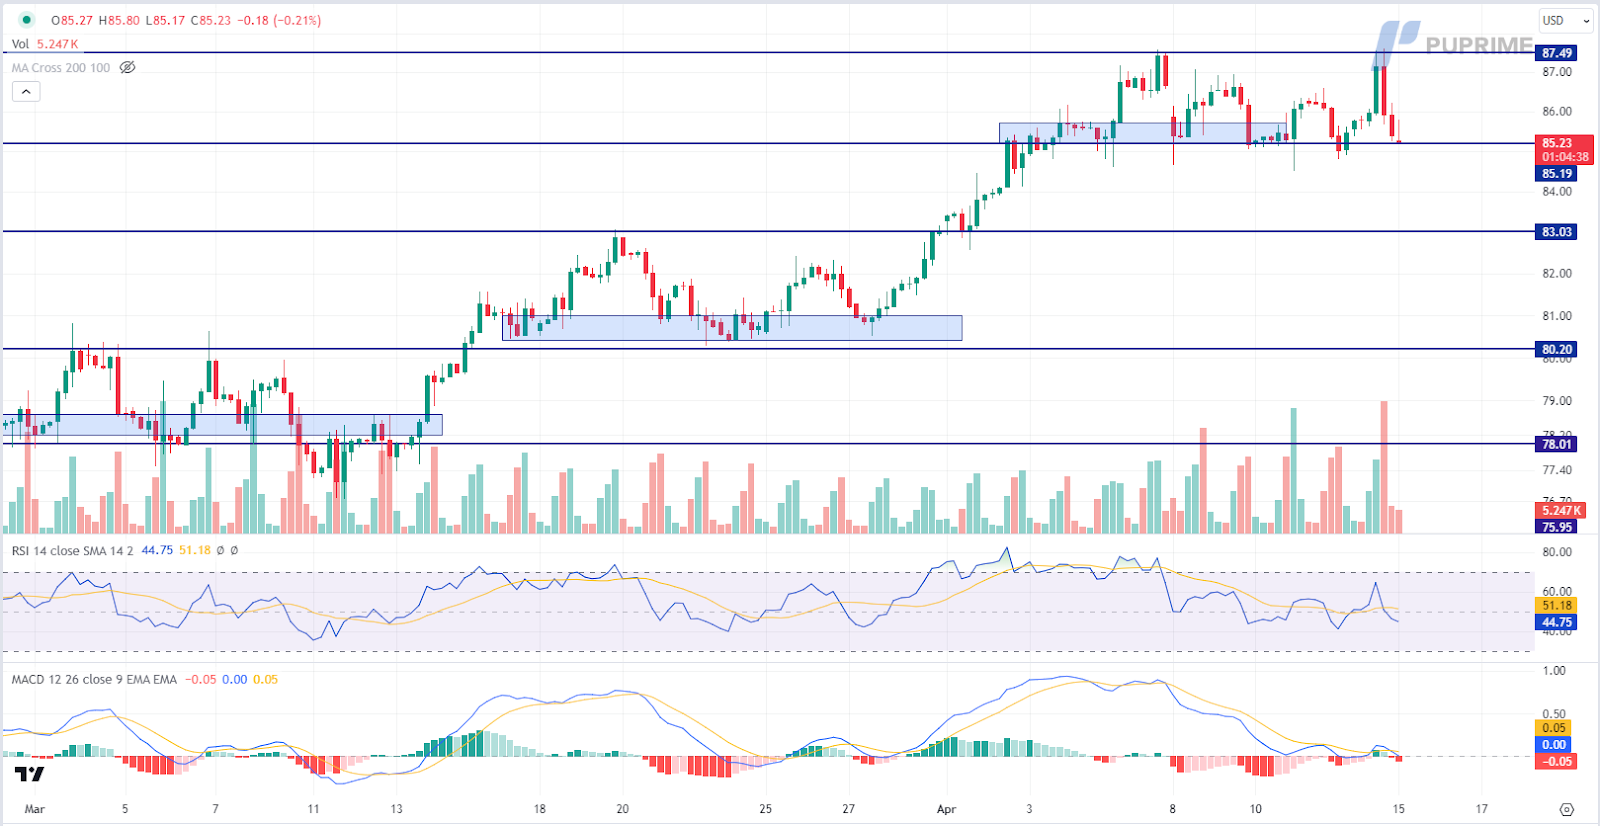
Oil prices continued to consolidate around positive levels following Iran’s attack on Israel, with further gains contingent upon Israel’s response. The attack, marking a direct assault on Israeli territory, heightened fears of a wider regional conflict. Analysts anticipate potential spikes in oil prices depending on the severity of Israel’s reaction and any subsequent actions by the G7 targeting Iranian crude oil exports.
Oil prices are trading lower while currently testing the support level. MACD has illustrated increasing bearish momentum, while RSI is at 45, suggesting the commodity might extend its losses after breakout since the RSI stays below the midline.
Resistance level: 87.50, 90.90
Support level: 85.20, 83.05

Tradez le Forex, les indices, Métaux et plus encore avec des spreads faibles et une exécution ultra-rapide.
Inscrivez-vous pour un compte réel PU Prime grâce à notre procédure simplifiée.
Approvisionnez facilement votre compte grâce à un large éventail de canaux et de devises acceptées.
Accédez à des centaines d’instruments avec les meilleures conditions de trading.
Plaquettes de trading
Entreprise
FAQs
Application PU Prime - Commencez à trader avec un avantage


Risk Warning: Trading Contract for Difference (CFD) carries a high level of risk to your capital and may result in losses that exceed your deposits due to leverage. It's important to understand how CFDs work and assess whether you can afford the high risk of losing your money. When acquiring our derivative products, you do not own or have rights in the underlying assets. Past performance is not indicative of future results. The information on this website is general and does not take into account your personal objectives, financial circumstances, or needs. Seek independent advice from qualified experts if necessary, and ensure you fully understand the risks before making any trading decisions.
PU Prime is a brand name of different entities authorised and registered in various jurisdictions.
PU Prime Limited is authorized and regulated by the Financial Services Authority of Seychelles under License No. SD050, with registered address at CT House, Office 1A, Providence, Mahe, Seychelles.
PU Prime Ltd is authorized and regulated by the Financial Services Commission of Mauritius under License No. GB23202672, with registered address at Suite 201 Level 2, The Catalyst Building, 40 Silicon Avenue, Cybercity Ebene, Mauritius.
PU Prime (Pty) Ltd is an authorised Financial Services Provider registered and regulated by the Financial Sector Conduct Authority of South Africa under License No. 52218, with registered address at 37 Harley Street, Ferndale, Randburg, Gauteng, South Africa.
The information on this website is not intended for residents of certain jurisdictions, including the United States, Singapore, Australia, China, Russia, and jurisdictions listed on the FATF and EU/UN sanctions lists. It is not intended for distribution or use where such distribution or use would be contrary to local law or regulation. While the Authority has granted a securities or derivatives investment business licence to the Licensee, it does not endorse the products offered.
Finzero Cap Ltd, registered in the Republic of Cyprus with registration number HE414308 and registered address at 62 Athalassas, Mezzanine, Strovolos 2012, Nicosia, Cyprus.
Copyright © 2024 PU Prime.
