PU Prime App
Exclusive deals on mobile


PU Prime App
Exclusive deals on mobile
Tenir les marchés mondiaux entre vos mains
Notre application de trading pour mobile est compatible avec la plupart des appareils intelligents. Téléchargez l’application dès maintenant et commencez à trader avec PU Prime sur tout appareil, à tout moment et en tout lieu.


27 July 2023,02:59
Daily Market Analysis
27 July 2023, 02:59


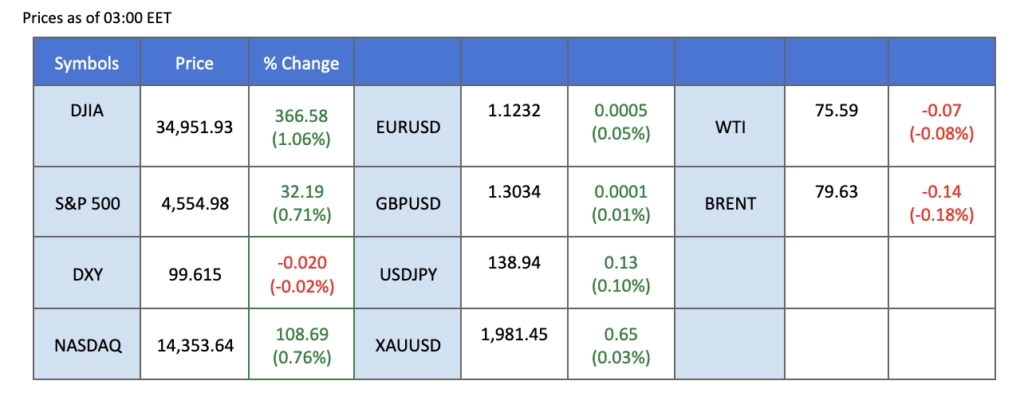
Strong quarterly results from Wall Street banks, Microsoft, and other major corporations fueled the US equity market’s upward momentum, while lacklustre economic data led to a dip in US treasury yields, signalling expectations of a more cautious stance by the Federal Reserve. The gold market experienced a significant surge as investors sought the safe-haven asset amid economic uncertainty and a weakening US Dollar. Oil prices rebounded on speculations of a potential pause in the Fed’s tightening cycle and OPEC production cuts, although gains were tempered by disappointing inventory data. Additionally, the New Zealand Dollar strengthened following positive inflation data, suggesting that the Reserve Bank of New Zealand may maintain its tightening monetary policy.
Current rate hike bets on 26th July Fed interest rate decision:
Source: CME Fedwatch Tool
0 bps (1%) VS 25 bps (99%)

US treasury yields dipped as expectations that the Federal Reserve will slow down its path for tightening monetary policy after downbeat economic data. According to the Census Bureau, US Retail Sales for last month came in at 0.20%, missing the market expectations of 0.50%. The first reaction for the US Dollar remained bearish, however the greenback slowly rebound back as investors continued to eye on the FOMC meeting with 25-basis points rate hikes expectations from the Federal Reserve.
The Dollar index is lower following the prior breakout below the previous support level. However, MACD has illustrated diminishing bearish momentum, while RSI is at 28, suggesting the index might enter oversold territory.
Resistance level: 101.45, 104.25
Support level: 98,70, 94.75
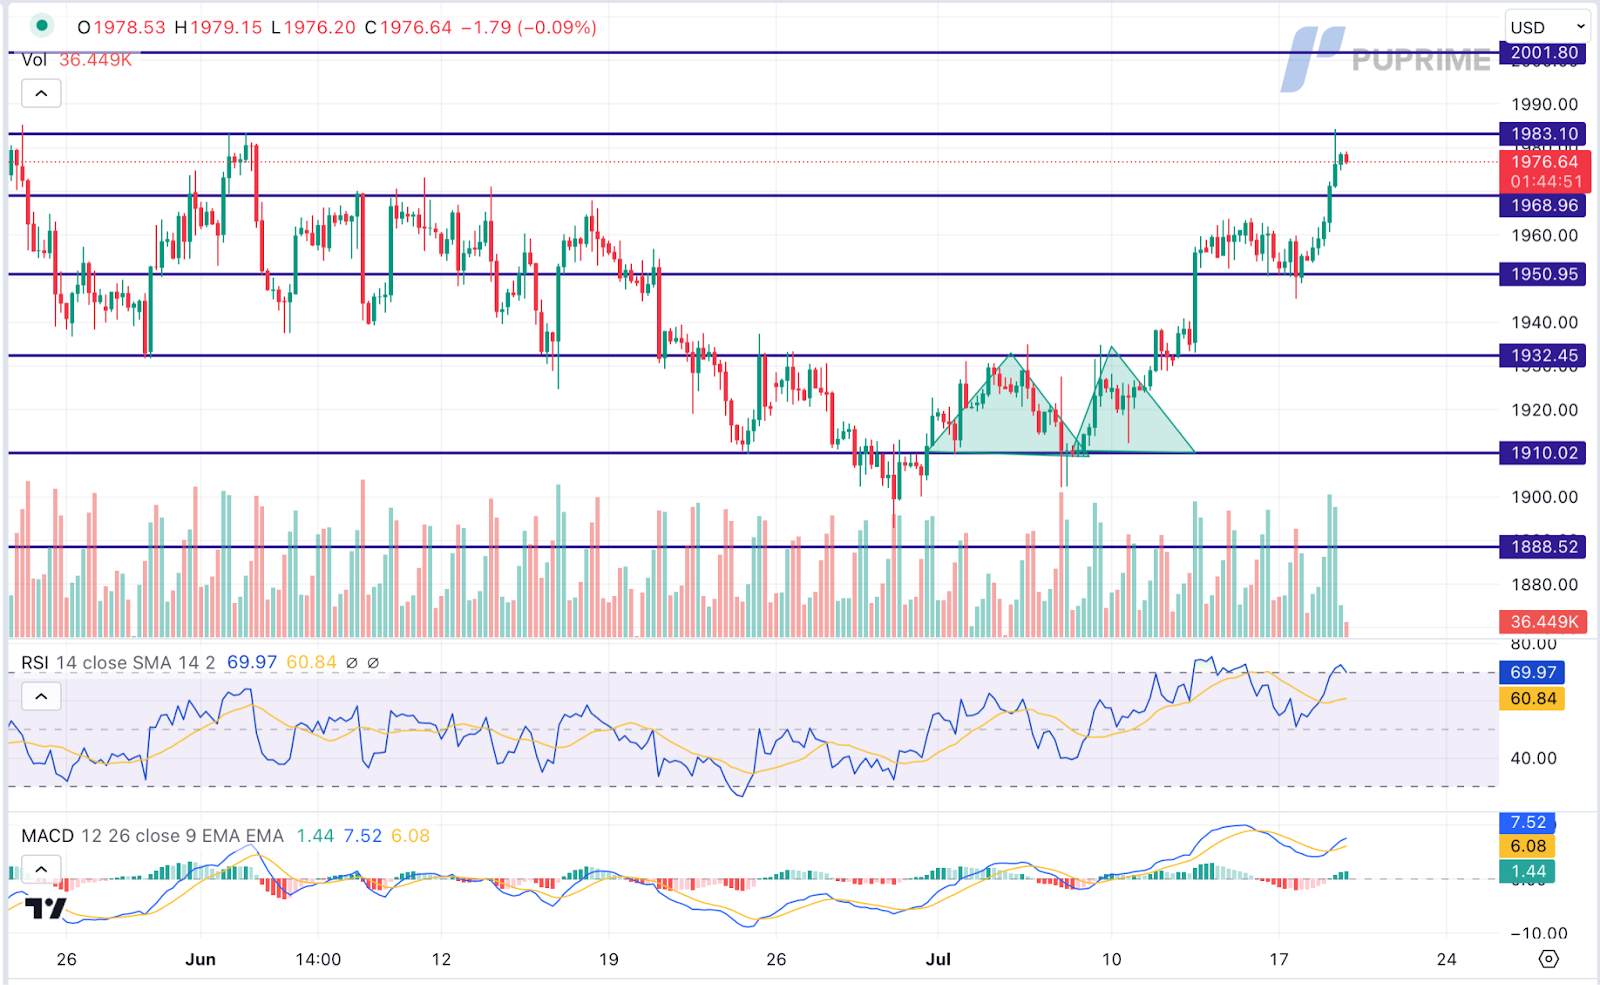
Gold market surged significantly over the backdrop against downbeat economic data from the United States, which stoked a shift in sentiment toward safe-haven gold. Besides, the depreciation of US Dollar due to a more pessimistic tightening monetary process had also further supported on the dollar-denominated commodity. All eyes are now on the Fed and what it will do for its interest rate when its policymakers sit again on 26th July to decide on rates.
Gold prices are trading higher while currently testing the resistance level. MACD has illustrated increasing bullish momentum. However, RSI is at 70, suggesting the commodity might enter overbought territory.
Resistance level: 1985.00, 2000.00
Support level: 1950.00, 1930.00
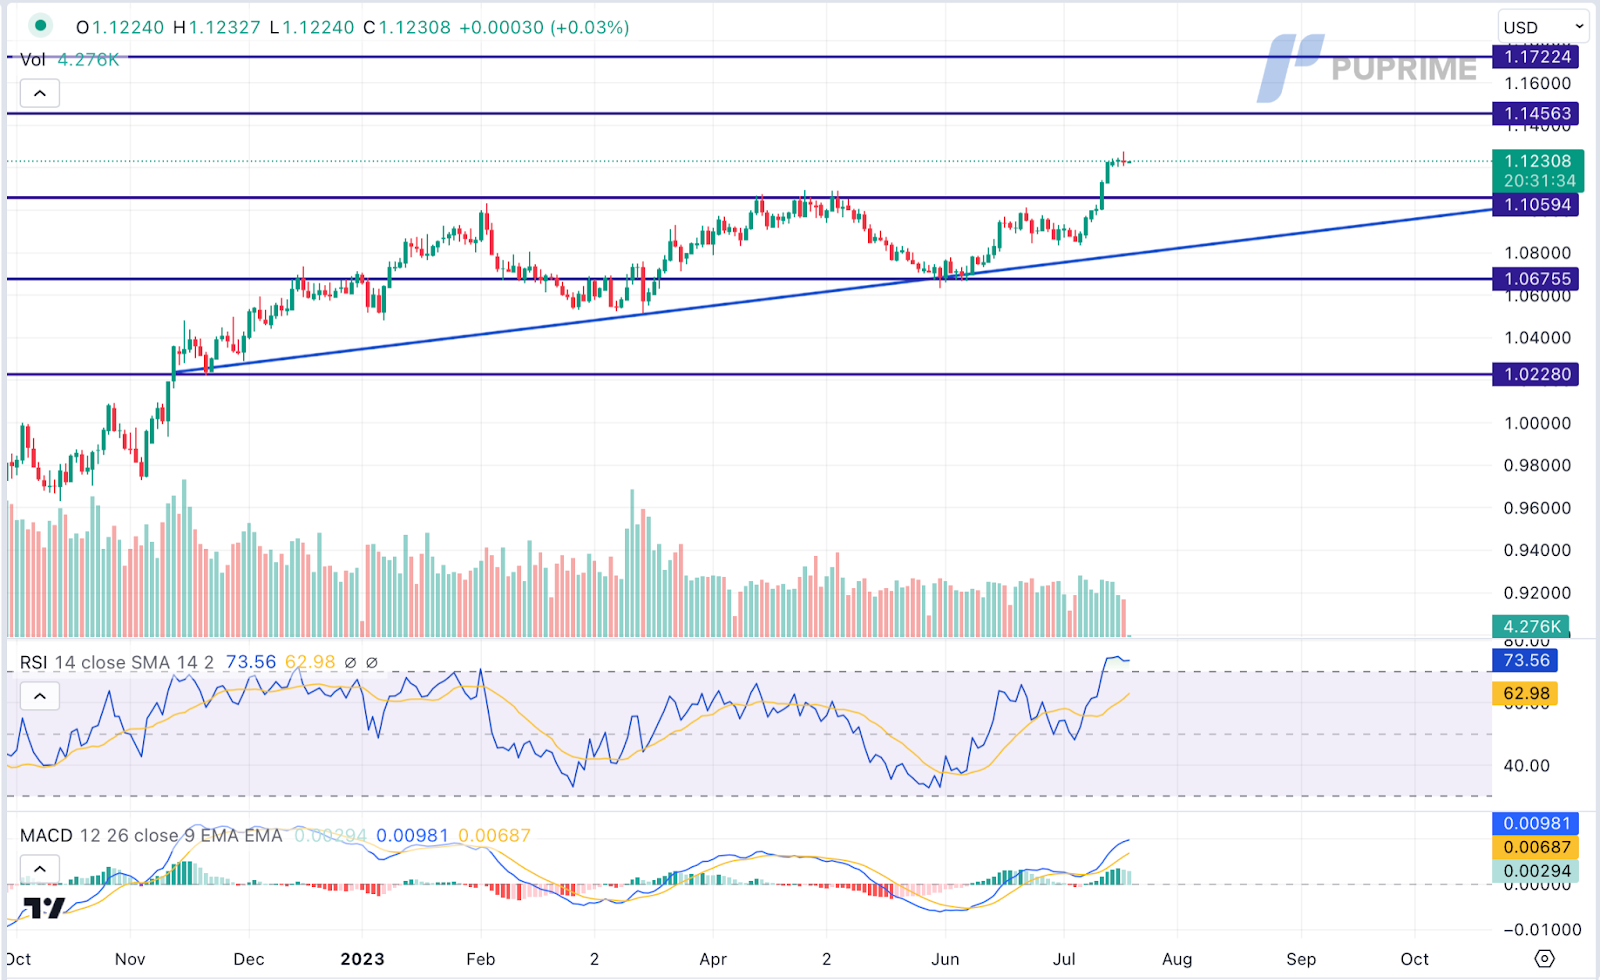
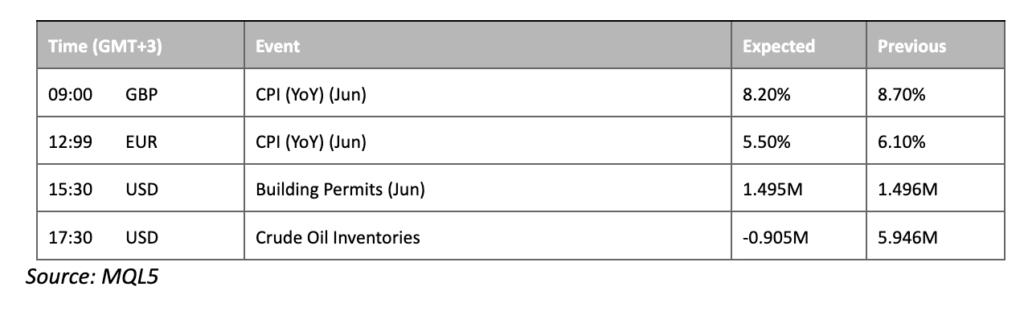
The Euro experienced a slight retreat from its key resistance level due to profit-taking; however, the long-term trend for the currency remained positive. Market participants anticipate that the European Central Bank will raise its benchmark interest rates in the future, and the tightening cycle is unlikely to conclude due to high inflation levels. In June, Germany, the largest economy in the eurozone, reported a year-on-year inflation rate of 6.80%, which remains higher than the central bank’s target.
EUR/USD is trading higher following the prior breakout above the previous resistance level. However, MACD has illustrated diminishing bullish momentum, while RSI is at 74, suggesting the pair might enter overbought territory.
Resistance level: 1.1455, 1.1720
Support level: 1.1060, 1.0675
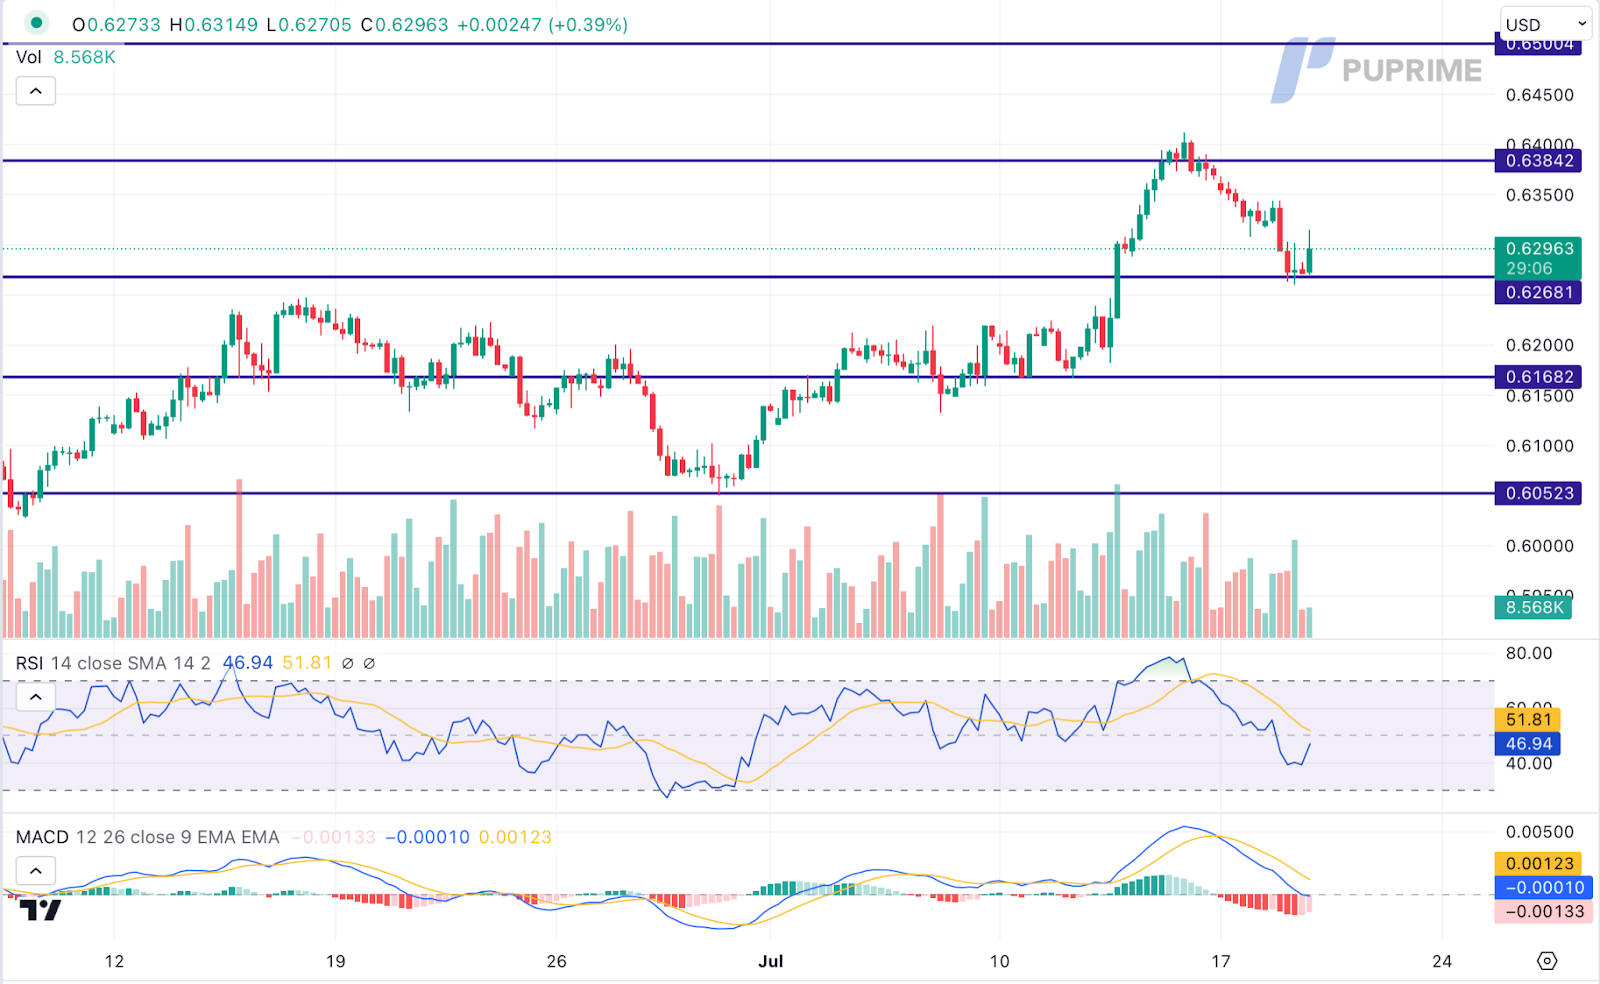
During early Asian trading hours, the New Zealand Dollar rebounded following the release of positive inflation data. According to Statistics New Zealand, the country’s Consumer Price Index (CPI) YoY exceeded market expectations at 6.0%, sparking anticipation that the Reserve Bank of New Zealand (RBNZ) would maintain its tightening monetary policy decisions.
NZD/USD is trading higher following the prior rebound from the support level. MACD has illustrated diminishing bearish momentum, while RSI is at 47, suggesting the pair might extend its gains since the RSI rebound from its oversold territory.
Resistance level: 0.6385, 0.6500
Support level: 0.6270, 0.6170
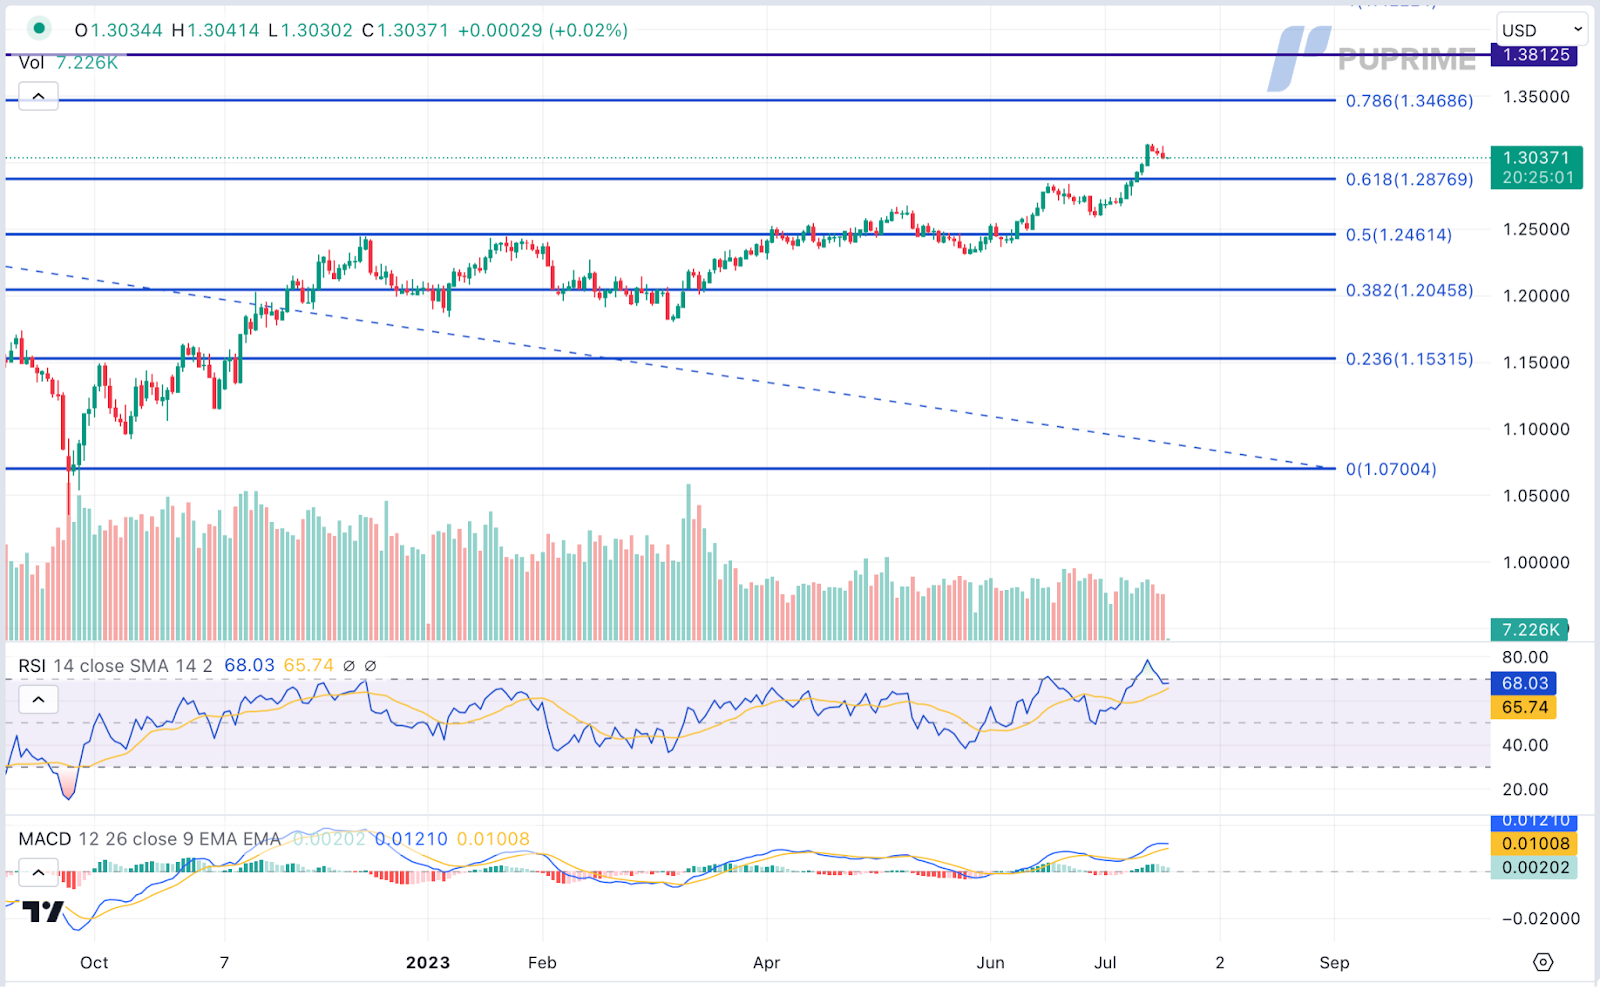
After reaching a record high, Pound Sterling retreated as investors took profit. Market participants now turn their attention to Wednesday’s UK core CPI, which holds significance for the Bank of England’s future decisions regarding a potential 25 or 50 basis point hike at the August meeting.
GBP/USD is trading lower while currently testing the support level. MACD has illustrated diminishing bullish momentum, while RSI is at 68, suggesting the pair might extend its losses after breakout its support level since the RSI retreated sharply from its overbought territory.
Resistance level: 1.3470, 1.3815
Support level: 1.2875, 1.2460
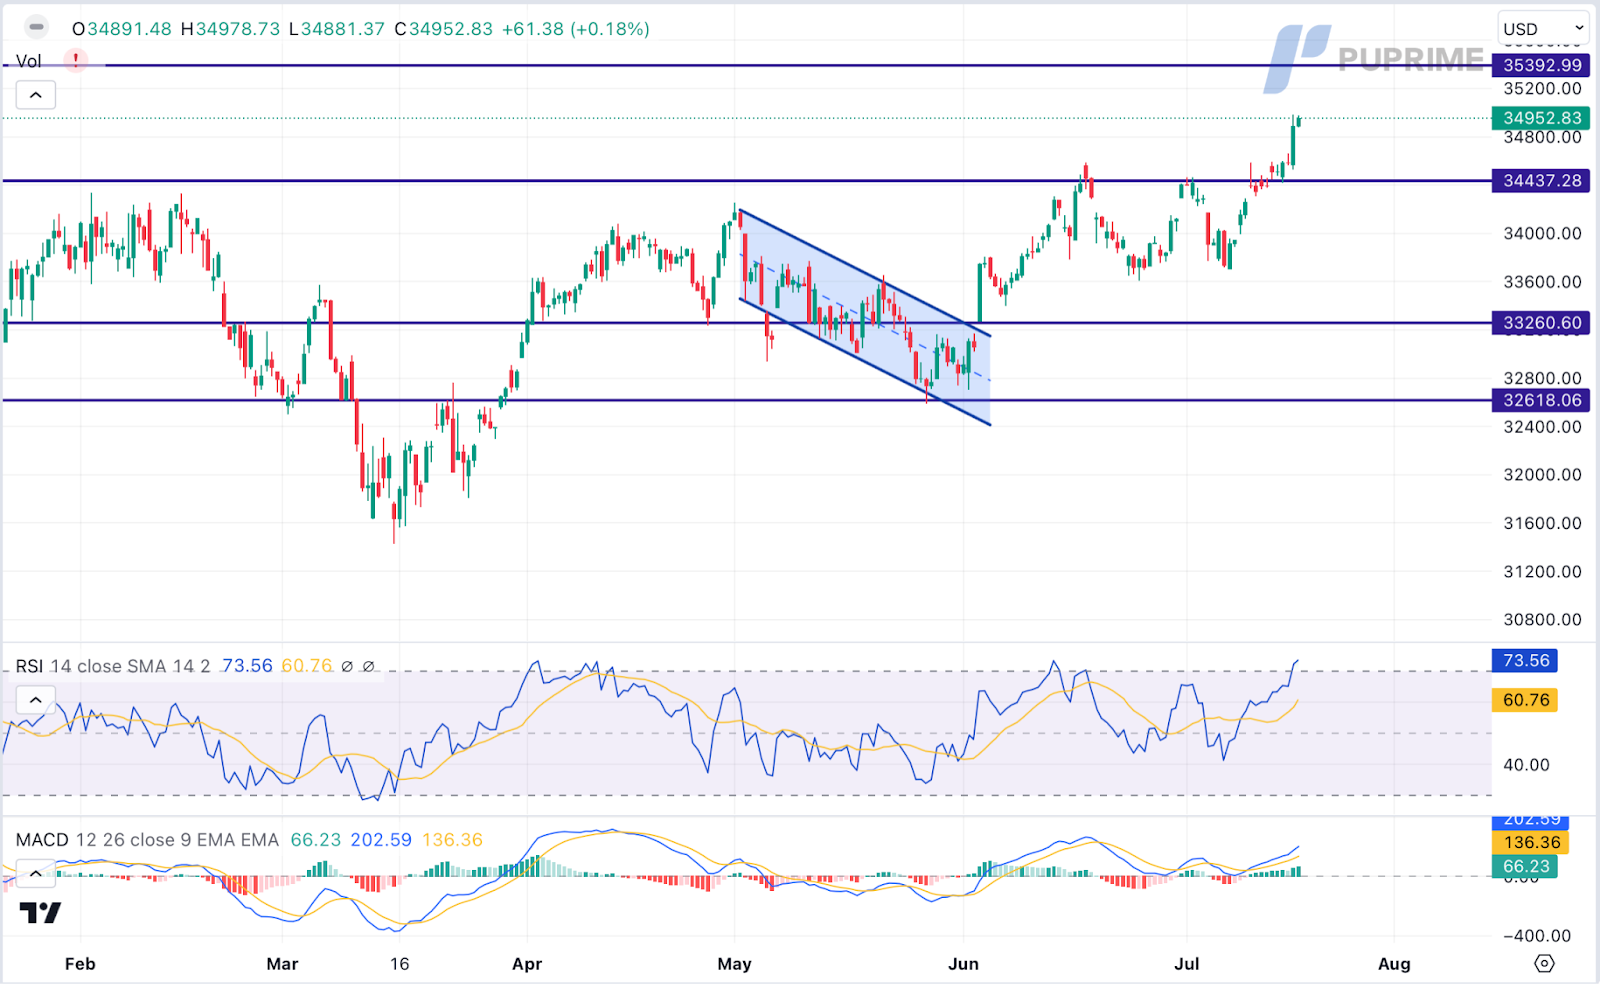
The US equity market continued its upward trajectory, bolstered by better-than-expected quarterly results from major corporations, including Wall Street banks and Microsoft. The tech giant reached a record high, driven by optimism surrounding its suite of artificial intelligence tools, which it announced would be accessible to businesses at a rate of $30 per user. Bank of America Corp and Morgan Stanley led the bullish move, with their shares experiencing significant gains after reporting second-quarter earnings that surpassed analysts’ estimates.
The Dow is trading higher following the prior breakout above the previous resistance level. MACD has illustrated increasing bullish momentum. However, RSI is at 74, suggesting the index might enter overbought territory.
Resistance level: 35395.00, 36415.00
Support level: 34435.00, 33260.00
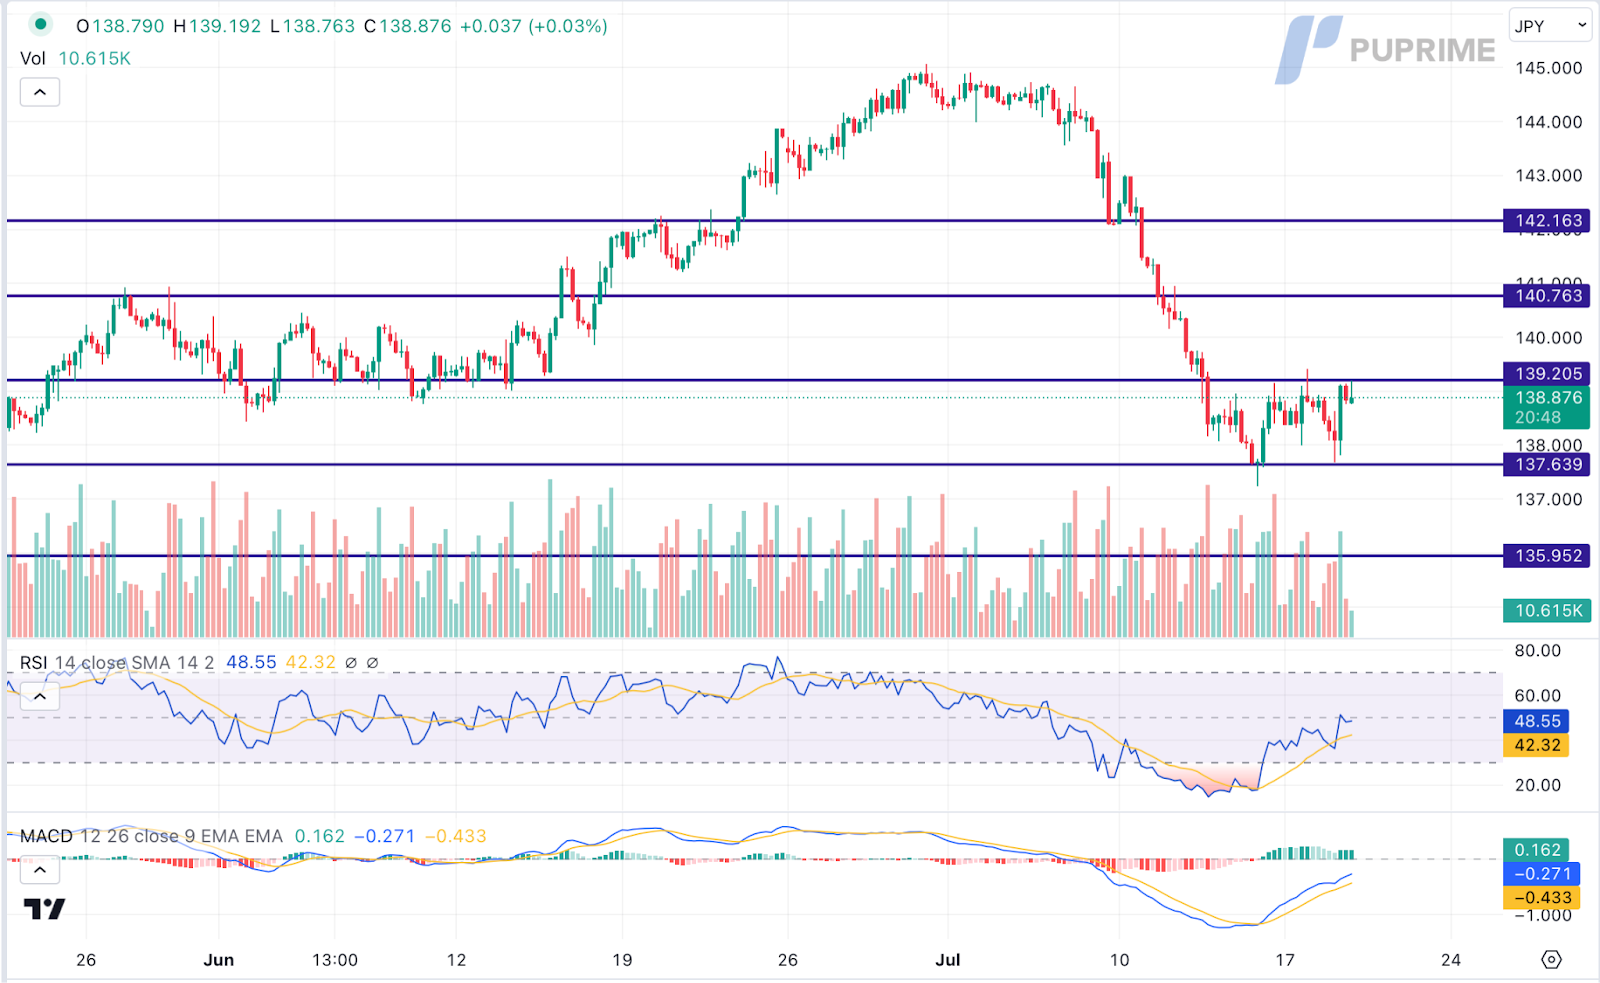
The Japanese yen experienced a decline after Bank of Japan (BoJ) Governor Kazuo Ueda stated that achieving the central bank’s 2% inflation target sustainably and stably still required some distance. This signalled the BoJ’s commitment to maintaining an ultra-loose monetary policy for the time being. Ueda emphasised that the BoJ had been patiently implementing its ultra-loose monetary policy under yield curve control (YCC), taking into consideration its impact on financial intermediation and market functioning.
USD/JPY is trading higher while currently testing the resistance level. MACD has illustrated increasing bullish momentum, while RSI is at 49, suggesting the pair might extend its gains after breakout since the RSI rebound sharply from oversold territory.
Resistance level: 139.20, 140.75
Support level: 137.65, 135.95
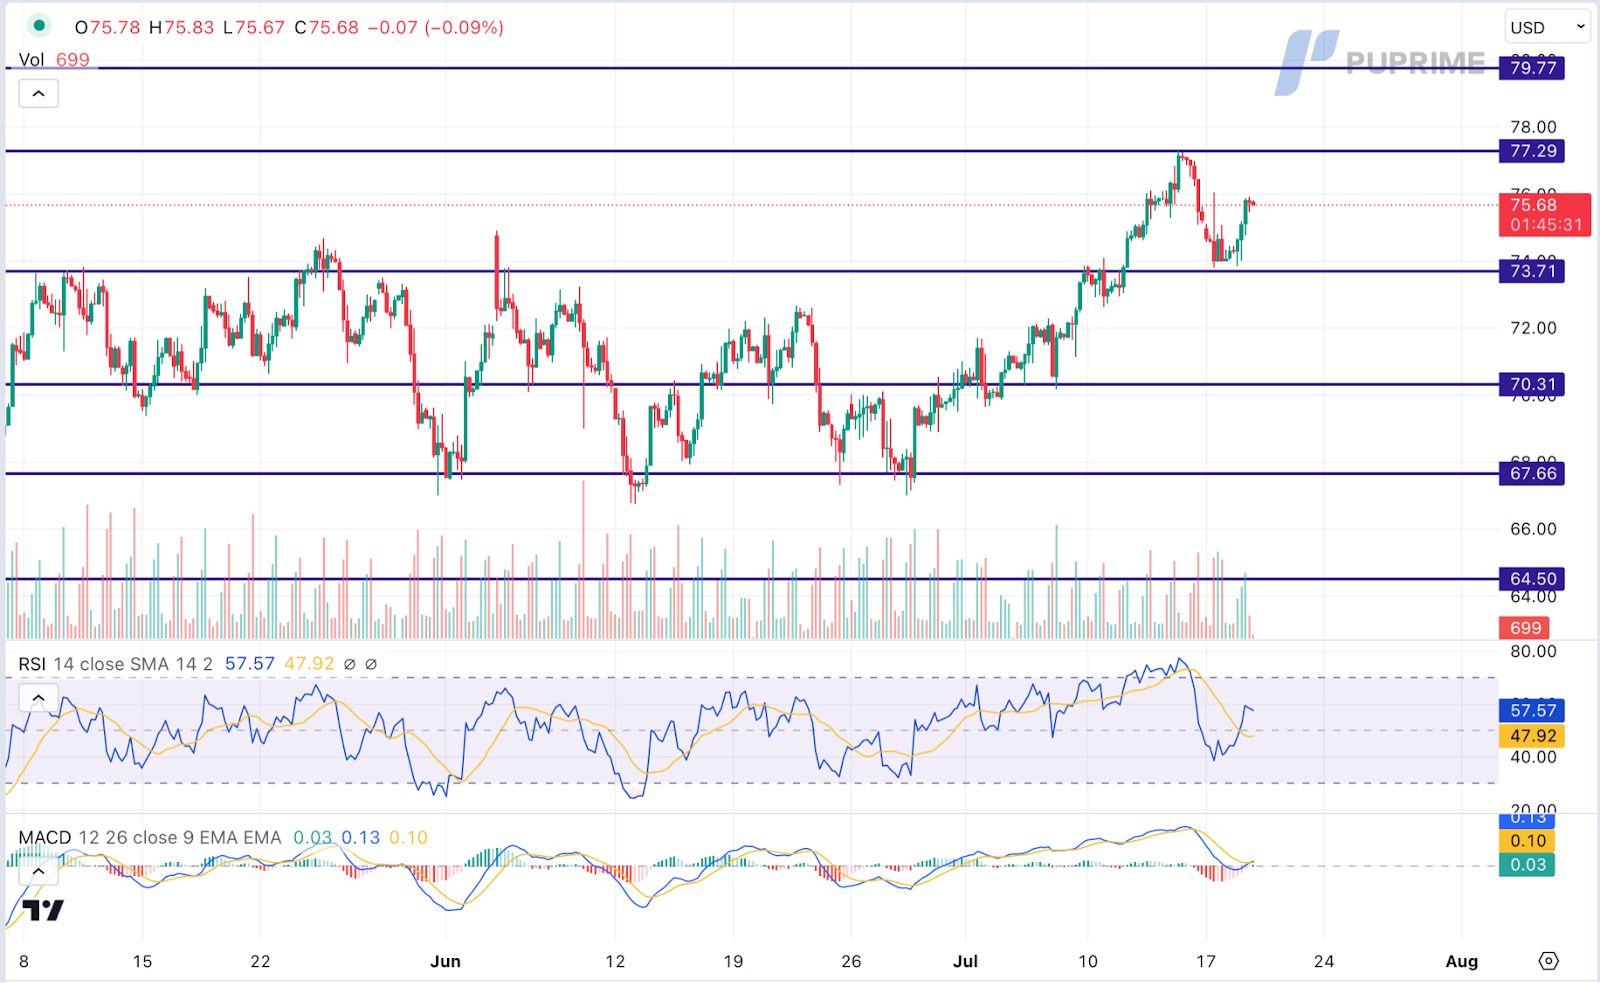
Oil prices regained and recovered all they lost in the previous session as attention from market participants as for now had shifted from the gloom over the Chinese economy to the expectations that the Federal Reserve might halt its tightening monetary policy path. The depreciation of the US Dollar as well as the OPEC+ oil production cuts recently had acted as a support for oil prices. However, the gains experienced by the oil prices are limited by downbeat inventory data. US API Weekly crude oil stock came in at -0.797M, declination is lower than the market expectations of -2.250M.
Oil prices are trading higher following the prior rebound from the support level. MACD has illustrated increasing bullish momentum, while RSI is at 58, suggesting the commodity might extend its gains toward resistance level since the RSI rebounded sharply from oversold territory
Resistance level: 77.30, 79.75
Support level: 73.70, 70.30

Tradez le Forex, les indices, Métaux et plus encore avec des spreads faibles et une exécution ultra-rapide.
Inscrivez-vous pour un compte réel PU Prime grâce à notre procédure simplifiée.
Approvisionnez facilement votre compte grâce à un large éventail de canaux et de devises acceptées.
Accédez à des centaines d’instruments avec les meilleures conditions de trading.
Plaquettes de trading
Entreprise
FAQs
Application PU Prime - Commencez à trader avec un avantage


Risk Warning: Trading Contract for Difference (CFD) carries a high level of risk to your capital and may result in losses that exceed your deposits due to leverage. It's important to understand how CFDs work and assess whether you can afford the high risk of losing your money. When acquiring our derivative products, you do not own or have rights in the underlying assets. Past performance is not indicative of future results. The information on this website is general and does not take into account your personal objectives, financial circumstances, or needs. Seek independent advice from qualified experts if necessary, and ensure you fully understand the risks before making any trading decisions.
PU Prime is a brand name of different entities authorised and registered in various jurisdictions.
PU Prime Limited is authorized and regulated by the Financial Services Authority of Seychelles under License No. SD050, with registered address at CT House, Office 1A, Providence, Mahe, Seychelles.
PU Prime Ltd is authorized and regulated by the Financial Services Commission of Mauritius under License No. GB23202672, with registered address at Suite 201 Level 2, The Catalyst Building, 40 Silicon Avenue, Cybercity Ebene, Mauritius.
PU Prime (Pty) Ltd is an authorised Financial Services Provider registered and regulated by the Financial Sector Conduct Authority of South Africa under License No. 52218, with registered address at 37 Harley Street, Ferndale, Randburg, Gauteng, South Africa.
The information on this website is not intended for residents of certain jurisdictions, including the United States, Singapore, Australia, China, Russia, and jurisdictions listed on the FATF and EU/UN sanctions lists. It is not intended for distribution or use where such distribution or use would be contrary to local law or regulation. While the Authority has granted a securities or derivatives investment business licence to the Licensee, it does not endorse the products offered.
Finzero Cap Ltd, registered in the Republic of Cyprus with registration number HE414308 and registered address at 62 Athalassas, Mezzanine, Strovolos 2012, Nicosia, Cyprus.
Copyright © 2024 PU Prime.
